
SLIDE 1
- 0 -
Germany on its Way to Paris Recent Developments and Future Strategy - - PowerPoint PPT Presentation
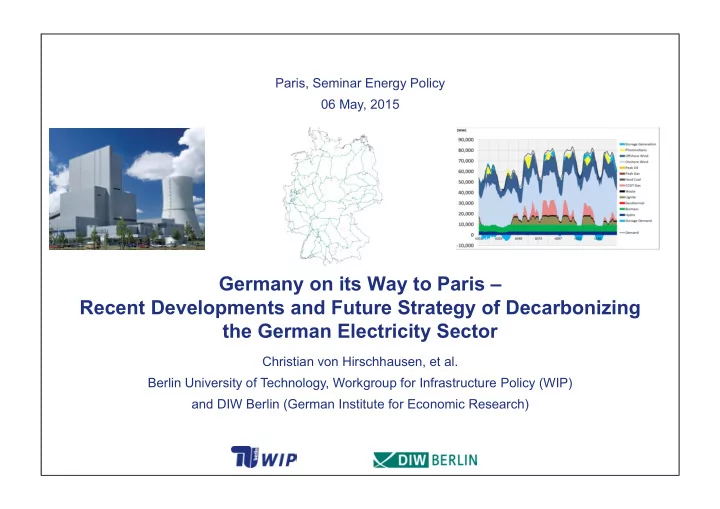
Paris, Seminar Energy Policy 06 May, 2015 Germany on its Way to Paris Recent Developments and Future Strategy of Decarbonizing the German Electricity Sector Christian von Hirschhausen, et al. Berlin University of Technology, Workgroup for
Kennedy-School, Lunchtime Seminar Energy Policy 05 November, 2012 Christian von Hirschhausen
Source: Schneider, Kuhs (2013)
n,t node, hour gn generation in n dn demand in n p(dn) demand function in n c(gn) generation costs in n
Pi,t load flow on line i
PSPup pump storage hydro (storage) PSPdown pump storage hydro (generation) windtinput from wind energy ni netinput
binary generation plant variable
n t n t n t n t n q t n
t n
, , , , , ,
* ,
, , , , , ,
n t n up t n down t n t n t n
xE pE Menge Preis Angebot Nachfrage A B E
Kohle- förderung KfW
CO2- tax EPS
Jahresmengen - nur neue vs. alte & neue KW IED-Richtlinie (Schwermetalle etc.) NRW*: 2020: -25% | 2050: -80% BB*: 2020: -40% | 2050: -95% BY: Energiekonzept, 2023, 2050 ETS:
Reserve 2°C-Ziel / COP 20/21 JI/ CDM Vattenfall: -30% (20102020) 20-20-20; 2030; 2050 Kohle- Ausstiegs- gesetz Steinkohle- Union Flexibilitäts- anforderungen / Mindest- wirkungsgrade Carbon Floor Price Ausgestaltung Kapazitätsmarkt Netzausbau Raumplanung/ Tagebaue
*) ggü. 1990 *) ggü. 1990
Klimaschutz plan (BMUB) BReg*: ‘20: -40% ‘30: -55% ‘50: -95%
Reduction
energy Share of Renewable Energy Reduction GHG- Emissions Reduction of Energy Demand Gross final energy Electricity Productio n Primary Energy Domestic Heat Final Energy Transport Electricity Demand 2015 2017 2019
2020 18% 35%
2021 2022 2025
40-45% 2030 2035 30% 50% 55-60%
2040 45% 65%
2050 60% 80%
95%
Basis 2010
2008 2008 2005 2008
Source: Own Depiction based on BReg (2010, 2011, 2013)
Neurath BoA II+III Boxberg - R RDK 8 Wilhelmshafen Hamm - D/E Moorburg I + II Walsum -10 Knapsack II GKM 9 Lichterfelde A Staudinger – 6 Klingenberg Brunsbüttel I + II GK Bremen
Krefeld/Uerdingen Lausward Lünen - Stummhafen Biblis A + B Brunsbüttel Isar 1 Isar2 Krümmel Neckarwestheim I Neckarwestheim II Philippsburg -1 Philippsburg 2 Unterweser Grafenrheinfeld Grundremmingen B Grundremmingen C Grohnde Brockdorf Emsland
Source: Matthes (2012, p. 45)
25 75 125 1 145 289 433 577 721 865 1009 1153 1297 1441 1585 1729 1873 2017 2161 2305 2449 2593 2737 2881 3025 3169 3313 3457 3601 3745 3889 4033 4177 4321 4465 4609 4753 4897 5041 5185 5329 5473 5617 5761 5905 6049 6193 6337 6481 6625 6769 6913 7057 7201 7345 7489 7633 7777 7921 8065 8209 8353 8497 8641 2025 2025 Gas CO2
20.000 40.000 60.000 80.000 100.000 120.000 Coal Gas Lignite Oil Waste DE 2025 2025 GasCO2
Wholesale price (2014) FÖS (2012) AEE (2011) DIW Berlin & Fh-ISI (2010)
Costs / Price [ct/kWh] External costs of lignite according to different studies compared to the current electricity price in Germany
Source: Oei, et al.(2014).
200 400 600 800 1.000 1.200 1.400 GHG Emissions in Megatons CO2 equiv.
2050 target*:
2020 Ziel*:
2030 target*:
*) Base line: 1990 Trend of the last years: emissions going up!
Source: Own depiction based on GCI (2011, 2013) and MIT (2014).
No EU-funding through NER-300 Longannet (UK, 1 Milliarde £) No CO2-priority infrastructure projects Mongstad (Norway) 9 cancelled projects in 2 years 19.10.2011 Jänschwalde (De, Vattenfall) 05.12.2011 08.12.2010 Hürth (De, RWE) „It‘s doubtable that [CCS] will come into action in Germany. [...] 18.12.2012 14.07.2012 14.10.2013 22.10.2013 20.09.2013 29.10.2011 „CO2 sequestration not relevant for energy transition“
Source: Own illustration based on Tagesspiegel (2010), BBC (2011), Märkische Rundschau (2011), Vattenfall (2011), Bundesregierung (2012), EC (2012), Bellona (2013), EC (2013), GCI (2013), EUWID (2014).
27.01.2014 Schleswig-Holstein (De) forbids CO2- storage
100 200 300 400 500 600 700 TWh Jahr Andere Photovoltaik Biomasse Wasserkraft Windkraft Mineralöl Kernenergie Erdgas Braunkohlen Steinkohlen
Source: AG Energiebilanzen 2012, BMU, 2011
Instrument Effect Possible advantages Possible shortcomings Proposed by ETS reform Price signal through the introduction
900 million backloading allowances directly in MSR, start of MSR in 2017 instead of 2021 EU‐wide instrument; thus, no cross‐border effects Structural reforms uncertain from today's perspective; the extent of the impact is unpredictable German government (2014)
(“floor”) CO2 certificates would become more expensive Investment security for investors Feasible prices probably too low to result in a switch from coal towards natural gas Bündnis 90/the Green Party (2014) Minimum efficiency level Closure of inefficient power plants More efficient utilization of raw materials Open cycle gas turbines (OCGT) would also be affected; complex test and measurement processes Bündnis 90/the Green Party (2009) Flexibility requirements Closure or singling out of inflexible power plants Better integration of fluctuating renewable energy sources Combined cycle gas turbines (CCGT) might also be affected Öko‐ Institut/LBD/Raue (2012) Coal phase‐out law Maximum production or emissions allowances Fixed coal phase‐out plan & schedule Auctioning difficult to predict Greenpeace (2012), DIE LINKE (2014) Emissions performance standard (specifically for new plants and retrofits) Restrictions for new plants and retrofits (without CO2 capture) Prevention of CO2‐ intensive investments Minor short‐term reduction in emissions IASS (2014) Emissions performance standard (cap for existing plants) Reduce load factor for older coal‐ fired power plants that have been written off Maintenance of generation capacities, e.g., by shifting into a strategic reserve Negative impact on economic efficiency
efficiency unclear IASS (2014) Capacityinstruments Incentives to develop lower‐carbon conventional capacities Support to natural gas plants, move coal plants into strategic reserve Danger of micro‐management, difficulties to identify concrete technical parameters to ensure lower‐carbon output Öko‐ Institut/LBD/Raue (2012) Source: Vattenfall risky business reoprt
5 10 15 20 25 30 35 J 05 J 06 J 07 J 08 J 09 J 10 J 11 J 12 J 13 J 14 €/Tonne CO2
Quelle: Kemfert et al (2014)
‐500 500 1.000 1.500 2.000 2.500 3.000 Überschuss [Millionen EUA]
Quelle: Kemfert et al (2014)
Quelle: eigene Darstellung basierend auf HM_Treasury (2011)
Quellen: Eig. Berechn. bas. auf Wagner et al. (2007), Stadtwerke Düsseldorf (2013), DIW Data Documentation (2014), BAFA (2014) Annahmen für Brennstoffpreis: BK: 4 €/MWh_th SK: 10 €/MWh_th Gas:32 €/MWh_th 20 40 60 80 100 120 140 160 Braunkohle -> Gas Steinkohle -> Gas
[€/t]
Benötigter CO2-Preis für Brennstoffwechsel
20 40 60 80 100 120 140 20 40 60 80 100 120 Kurzfr. Erzeugungs- kosten inkl. CO2-Kosten [€/MWh_el] CO2-Preis [€/t]
Braunkohle vs. GuD (alt / neu)
GuD Braunkohle 20 40 60 80 100 120 140 20 40 60 80 100 120 CO2-Preis [€/t]
Steinkohle vs. GuD (alt / neu)
GuD Steinkohle