
SLIDE 1
Geovisualization Challenges of Seascape Genetics - GeoViz 2011
Geovisualization Challenges of Seascape Genetics Geovisualization - - PowerPoint PPT Presentation
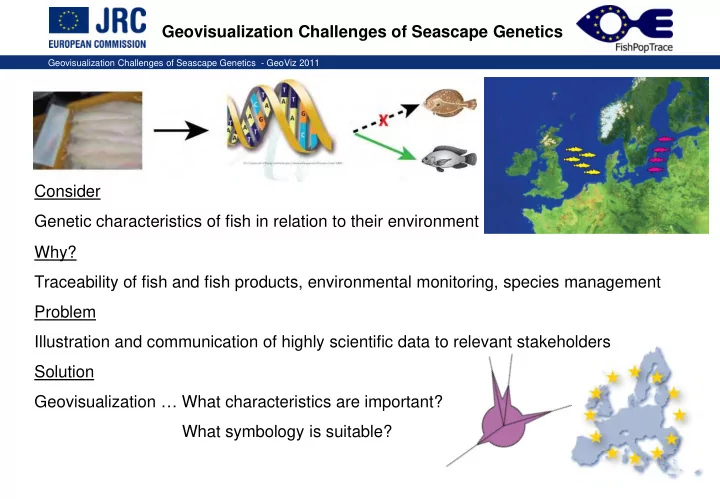
Geovisualization Challenges of Seascape Genetics Geovisualization Challenges of Seascape Genetics - GeoViz 2011 Consider Genetic characteristics of fish in relation to their environment Why? Traceability of fish and fish products,
Geovisualization Challenges of Seascape Genetics - GeoViz 2011
Geovisualization Challenges of Seascape Genetics - GeoViz 2011
European Commission Joint Research Centre Maritime Affairs Unit, Ispra, Italy
Geovisualization Challenges of Seascape Genetics - GeoViz 2011
Geovisualization Challenges of Seascape Genetics - GeoViz 2011
Geovisualization Challenges of Seascape Genetics - GeoViz 2011
Geovisualization Challenges of Seascape Genetics - GeoViz 2011
Geovisualization Challenges of Seascape Genetics - GeoViz 2011
Image: www.bioinsights.com
Geovisualization Challenges of Seascape Genetics - GeoViz 2011
Geovisualization Challenges of Seascape Genetics - GeoViz 2011
Geovisualization Challenges of Seascape Genetics - GeoViz 2011
Geovisualization Challenges of Seascape Genetics - GeoViz 2011
Geovisualization Challenges of Seascape Genetics - GeoViz 2011
Geovisualization Challenges of Seascape Genetics - GeoViz 2011
(FishPopTrace analysis slightly falsified)
Geovisualization Challenges of Seascape Genetics - GeoViz 2011
Geovisualization Challenges of Seascape Genetics - GeoViz 2011
Geovisualization Challenges of Seascape Genetics - GeoViz 2011
Geovisualization Challenges of Seascape Genetics - GeoViz 2011
Image from www.nasa.gov
Image from Brundsdon et. al.
Geovisualization Challenges of Seascape Genetics - GeoViz 2011
Cluster 5
Geovisualization Challenges of Seascape Genetics - GeoViz 2011
Geovisualization Challenges of Seascape Genetics - GeoViz 2011
Geovisualization Challenges of Seascape Genetics - GeoViz 2011
Geovisualization Challenges of Seascape Genetics - GeoViz 2011
Geovisualization Challenges of Seascape Genetics - GeoViz 2011
Geovisualization Challenges of Seascape Genetics - GeoViz 2011