
SLIDE 1
Gamma-ray blazars Stefan Larsson Dalarna University and KTH for - - PowerPoint PPT Presentation
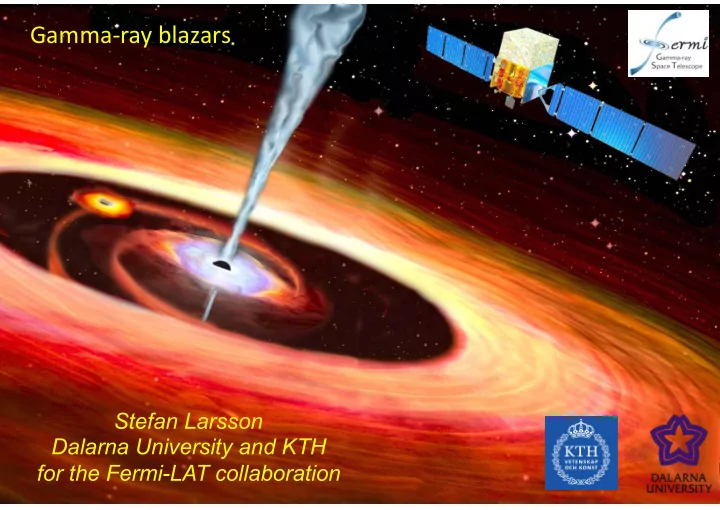
Gamma-ray blazars Stefan Larsson Dalarna University and KTH for the Fermi-LAT collaboration Blazars Blazars are AGN with a relativistic jet pointing towards our line of sight Doppler boosting: Bright and rapidly variable Boston University
Lund 2020 Stefan Larsson
Boston University Blazar Research Group http://www.bu.edu/blazars/bllac_files/agn_nature_cam3_360sqpix.mov
Lund 2020 Stefan Larsson
> 5000 point sources
Lund 2020 Stefan Larsson
Lund 2020 Stefan Larsson
Lund 2020 Stefan Larsson
Lund 2020 Stefan Larsson
54000 55000 56000 57000 58000 59000 MJD 5.0×10⁻⁹ 1.0×10⁻⁸ 1.5×10⁻⁸ 2.0×10⁻⁸ 2.5×10⁻⁸ 3.0×10⁻⁸ Flux (E > 1 GeV) [ cm-2 s-1 ]
Lund 2020 Stefan Larsson
Lund 2020 Stefan Larsson
(Cheung et al 2014 ApJL 782 L14)
Autocorrelation analysis of Fermi- LAT data
50 100 150 200 250 F
γ (10 −6 photons cm −2s −1)1 2 3 4 5
Flaring Interval
1−day bins
Fermi ToO pointing
pre 1st 2nd 3rd post
2012 Jun 22 − 2013 Mar 14
T (MJD − 56100 days)
Lag = 11.46 ± 0.16 d
Lund 2020 Stefan Larsson
Lund 2020 Stefan Larsson
µ
a b
Lund 2020 Stefan Larsson
Non/slowly variable component?
Lund 2020 Stefan Larsson
Fig.2. Left Panel rms-flux relationship for Cyg X-1 [22]
Uttley & McHardy,2001,MNRAS,323,L26
6 8 10 12 14 0.5 1 1.5 2 2.5 RMS FLUX 1 1.5 2 2.5 3 0.2 0.4 0.6 0.8 RMS FLUX
Fig.5. Left Panel rms-flux relationship for 3C273 derived from the X-ray lightcurve shown in Fig.4.
3C 273 3C 279
Lund 2020 Stefan Larsson
Lund 2020 Stefan Larsson
statistical Discrete Cross-Correlation Function analysis
2e-07 4e-07 6e-07 8e-07 flux (E>100 MeV) [ph cm
Fermi-LAT
J1159+2914
54800 55000 55200 55400 55600 55800 MJD 1 2 3 4 flux density [Jy]
0.8 mm 2 mm 3 mm 7 mm 9 mm 13 mm 20 mm 28 mm 36 mm 60 mm 110 mm
relative timing of flares
0.0 0.5 1.0 1.5
J1159+2914
200 400 600 LAG (Days)
0.0 0.5 1.0 1.5 DCCF
Stacked DCCF
200 400 600
0.0 0.1 0.2 0.3 0.4 DCCF
Lund 2020 Stefan Larsson
200 400 LAG (Days)
0.0 0.5 1.0 1.5 2.0 DCCF
50 100 150 200 250 300 350 frequency [GHz] 20 40 60 80 100 time lag [days] τ = Α + Βν
−1
0.5 1 1.5 2 2.5 log (frequency) 0.3 0.6 0.9 1.2 1.5 1.8 2.1 log (time lag)
0.8 mm 11 cm
Lund 2020 Stefan Larsson