
SLIDE 1
T
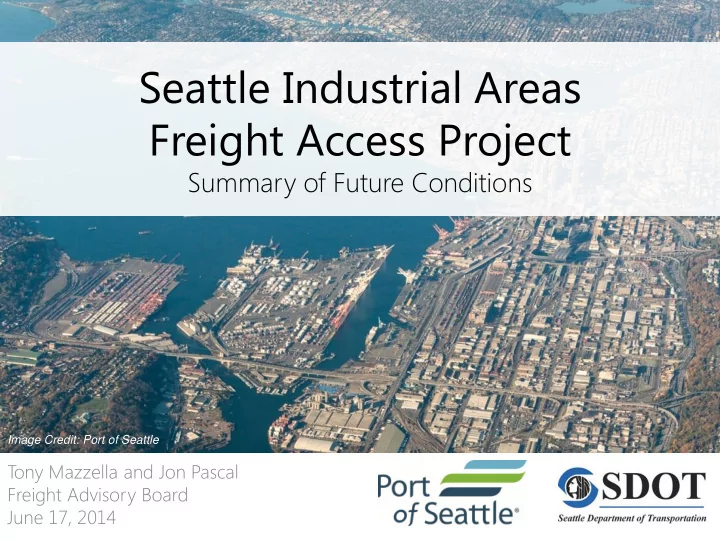
- ny Mazzella and Jon Pascal
Freight Advisory Board June 17, 2014
Seattle Industrial Areas Freight Access Project
Summary of Future Conditions
Image Credit: Port of Seattle
Freight Access Project Summary of Future Conditions Image Credit: - - PowerPoint PPT Presentation
Seattle Industrial Areas Freight Access Project Summary of Future Conditions Image Credit: Port of Seattle T ony Mazzella and Jon Pascal Freight Advisory Board June 17, 2014 Presentation overview What drives future traffic growth
T
Freight Advisory Board June 17, 2014
Image Credit: Port of Seattle
2
5
Vehicle mode Reasons change occurs
Sources Commodity Flow Profile from Freight Analysis Framework (FAF3) Source Port of Seattle Container T erminal Access Study Source
6
7 Source: PSRC Employment Forecasts, 2010.
Annual Growth Rate = 1.1% Annual Growth Rate = 1.2% 0% 20% 40% 60% 80% 100% 2010 2035 2010 2035 2010 2035 2010 2035 Ballard-Interbay MIC Duwamish MIC Seattle PSRC Region Retail/Food Man/WTU Const/Res
% Share of Total Employment by Geography
Annual Growth Rate = 1.8% Annual Growth Rate = 1.8%
8
Source: Regional Forecasts from FHWA's FAF3 National Model and Cambridge Systematics Assumptions on Average Truck Payload Factors by Commodity.
20,000 30,000 40,000 50,000 60,000 2011 2035 Unknown Food / Agri Prods Retail Prods Mfg Prods Const Prods / Res
Annual Growth Rate = 2.7%
Estimated Daily Non-Port Loaded Truck Trips in Seattle CSA Region
9 Source: Port of Seattle Container T erminal Access Study, 2014.
10
Mercer er Stree eet Impr provem vements Seattle e Water erfron
Viaduct Removal al and Bored ed Tunnel Argo go Yard d North h Access ess Lander er Stree eet Grade de Separat ation
South h Park Bridge dge Repl placem ement ent LINK Light Rail Extensi sion
SR520 Bridg dge e Repl placem ement ent
11
– Alaskan Way Viaduct Replacement – Mercer Street Improvements – Seattle Waterfront / Alaskan Way – Lander Street Grade Separation
12
Example Map
Average Daily Traffic Volume (ADT) Average Daily Truck Volume Color represents percent of trucks in the traffic stream
Forecast Existing
PRELI ELIMINA MINARY RY
Forecast Existing
PRELI ELIMINA MINARY RY
Existing Forecast
PRELI ELIMINA MINARY RY
17