Framework, Challenges, and Studies the processes and procedures - - PDF document

framework challenges and studies the processes and
SMART_READER_LITE
LIVE PREVIEW

Framework, Challenges, and Studies the processes and procedures - - PDF document

10/28/2014 What is implementation science? Implementation Science: Framework, Challenges, and Studies the processes and procedures that promote Multidisciplinary Approaches the transfer of evidence-based intervention into real- world


slide-1
SLIDE 1

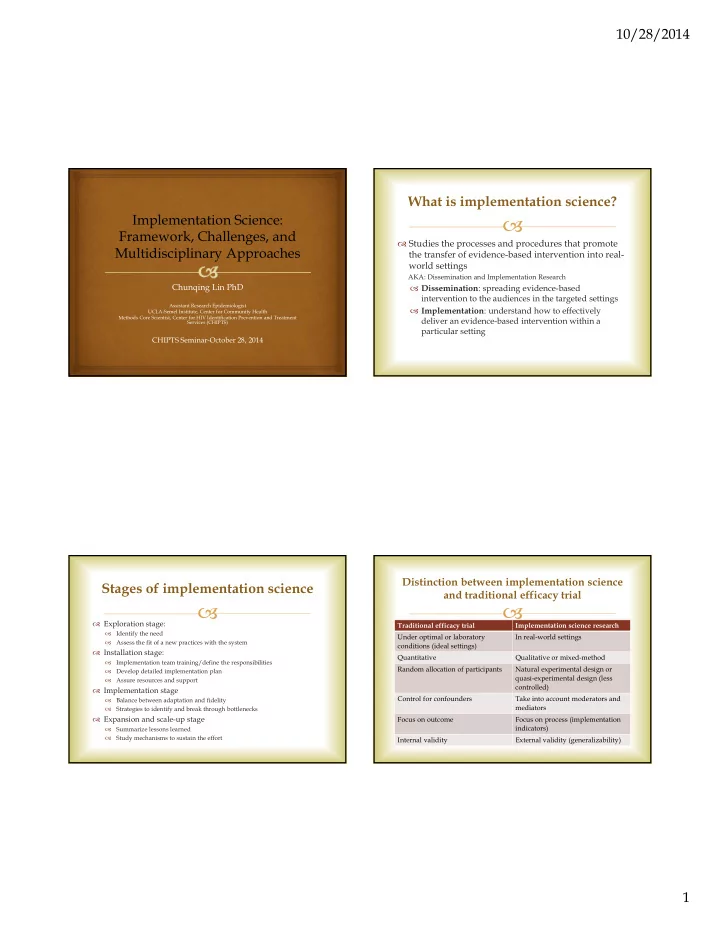
10/28/2014 1 Implementation Science: Framework, Challenges, and Multidisciplinary Approaches

Chunqing Lin PhD

Assistant Research Epidemiologist UCLA-Semel Institute, Center for Community Health Methods Core Scientist, Center for HIV Identification Prevention and Treatment Services (CHIPTS)

CHIPTS Seminar-October 28, 2014

 Studies the processes and procedures that promote the transfer of evidence-based intervention into real- world settings

AKA: Dissemination and Implementation Research

 Dissemination: spreading evidence-based intervention to the audiences in the targeted settings  Implementation: understand how to effectively deliver an evidence-based intervention within a particular setting

What is implementation science?

 Exploration stage:

 Identify the need  Assess the fit of a new practices with the system

 Installation stage:

 Implementation team training/define the responsibilities  Develop detailed implementation plan  Assure resources and support

 Implementation stage

 Balance between adaptation and fidelity  Strategies to identify and break through bottlenecks

 Expansion and scale-up stage

 Summarize lessons learned  Study mechanisms to sustain the effort

Stages of implementation science

Traditional efficacy trial Implementation science research Under optimal or laboratory conditions (ideal settings) In real-world settings Quantitative Qualitative or mixed-method Random allocation of participants Natural experimental design or quasi-experimental design (less controlled) Control for confounders Take into account moderators and mediators Focus on outcome Focus on process (implementation indicators) Internal validity External validity (generalizability)

Distinction between implementation science and traditional efficacy trial

slide-2
SLIDE 2

10/28/2014 2

 New field:

 Little consensus on optimal scientific methodology and terminology

 Measurement issue

 Lack of agreement on definitions of constructs and measures

 Complexity:

 Multilevel factors (e.g., policies, work processes culture and regulations, employees, technology etc.)  Multidisciplinary (economics, social science, public health, marketing, public policy etc.)

 Insufficient sample size

Implementation science challenges

RCT “White Coat, Warm Heart (WW)”  1760 service providers from 40 county hospitals in two provinces

  • f China

 Aim: to reduce service providers’ stigmatizing attitudes and behaviors towards PLH Intervention:

Identified the trained popular opinion leader providers to disseminate intervention message Provide universal precaution supplies

Outcome:

Significantly reduced prejudicial attitude and avoidance intent towards PLH at 6- and 12-month

Li L, Wu Z, Liang L-J, Lin C, Guan J, Jia M, et al. Reducing HIV-Related Stigma in Health Care Settings: A Randomized Controlled Trial in China. American Journal of Public Health, 2013, 103 (2), 286-292.

Case study

Hospital gatekeepers’ preferences and decision-making in adoption of the intervention model Heterogeneous across hospitals--Structural bottleneck of intervention implementation

Study questions

 A statistical technique used in market research, and later applied in research of individual health behavior  Aim: to determine what feature of a product is most influential

  • n stakeholder’s decision making

 Instead of presenting a series of disparate single item feature, we present an array of product attributes, to determine the relative importance of different features

Conjoint analysis

slide-3
SLIDE 3

10/28/2014 3

 Cellphone plans:

 Price: 60 dollars/m; 75 dollar/m; 100 dollars/m  Minutes: 800 minutes/m; 1500 minutes/m; 4000 minutes/m  Reception: excellent; good; average  Rollover options: yes or no

 Survey question: Which of the following cell phone plans do you prefer?

An example of conjoint analysis

Plan Price Minutes Reception Rollover A 60 dollars/m 800 minutes/m Average Yes B 75 dollars/m 1500 minutes/m Excellent Yes C 100 dollars/m 4000 minutes/m Good No

 To model stakeholders’ preferences and decision-making in adoption of the WW intervention model  Steps:

 Determine the features (attributes) of the intervention model  Generate conjoint scenarios as combinations of attributes  Present the scenarios and have respondents rate each scenrario  Data analysis

Application in implementation science

 The attributes and levels were determined based on the findings from literature review and in-depth interviews with healthcare administrators and hospital directors  Seven attributes: administrative support, cost, personnel involved, format and duration of the training, availability of technical support, and if reducing stigma is a priority of the healthcare facility  Two levels for each attribute to avoid complexity

Attributes

 27 = 128 possible scenarios  To avoid complexity, we use Fractional factorial orthogonal design to yield 8 scenarios  SAS macro to create efficient factorial designs :

%mktex(2 2 2 2 2 2 2, n=8) %mktlab(vars=A B C D E F G , out=sasuser.design) %mkteval; proc print data=sasuser.design; run;

 Output

Scenarios

Obs A B C D E F G 1 2 2 2 2 1 1 1 2 1 1 2 2 1 2 2 3 2 1 1 2 2 2 1 4 1 2 1 2 2 1 2 5 1 1 1 1 1 1 1 6 2 2 1 1 1 2 2 7 2 1 2 1 2 1 2 8 1 2 2 1 2 2 1

slide-4
SLIDE 4

10/28/2014 4

WW intervention scenarios

WW intervention scenarios Attributes Administrative support Cost Personnel involved Duration of the training Format Availability of technical support Priority of reducing stigma 1 Minimum Relatively cheap 50% Short (e.g. 1-month) Flexible (internet-based) Maximum No 2 Maximum Relatively expensive 50% Short (e.g. 1-month) Flexible (internet-based) Minimum Yes 3 Minimum Relatively expensive 20% Short (e.g. 1-month) Inflexible (group sessions) Minimum No 4 Maximum Relatively cheap 20% Short (e.g. 1-month) Inflexible (group sessions) Maximum Yes 5 Maximum Relatively expensive 20% Long (e.g. 3-month) Flexible (internet-based) Maximum No 6 Minimum Relatively cheap 20% Long (e.g. 3-month) Flexible (internet-based) Minimum Yes 7 Minimum Relatively expensive 50% Long (e.g. 3-month) Inflexible (group sessions) Maximum Yes 8 Maximum Relatively cheap 50% Long (e.g. 3-month) Inflexible (group sessions) Minimum No

 Sample size: Given the semi-qualitative nature of conjoint analysis, we proposed to recruit 60 hospital directors.  Participants recruited from different levels and types of healthcare facilities

 1/3 from provincial level hospitals, 1/3 from city level hospitals, 1/3 from country level hospitals  2/3 from general hospital, 1/3 from specialized hospitals  About 10 from WW intervention hospitals

 Eligibility: 18 years and above, and be a director (or associated director) of a hospital in the study area  Selection: based on the leadership recommendation and knowledge of related policy/practise  Voluntary and informed consent

Participants

 One-on-one face-to-face  First introduce the purpose, design, and outcome of the WW intervention  Present eight intervention scenarios using a set of answer cards  Participants will be asked to rate each scenario in terms of the possibility to adopt the program in the healthcare facilities  Five categories ratings: “Highly likely”, “Somewhat likely”, “Neutral”, “Somewhat unlikely”, and “Highly unlikely”  Query feasibility of administering conjoint scenarios

Scenario administration

Answer cards

slide-5
SLIDE 5

10/28/2014 5

 Transform the ratings into a 0–100 acceptability scale, with ‘highly likely’ scored as 100 and ‘highly unlikely’ scored as 0  For each respondent, a multiple regression model is fit to their acceptability scores Yi for the eight hypothetical scenarios, i = 1, .., 8; the seven attributes Ap, p = 1, .., 7, serve as independent variables in the model:

Yi = ß0 + Σ ßpAp + εi

where Σ is a summation over the seven regression coefficients ßp and attributes and εi is a residual error term.

 The regression coefficient for each attribute is the impact score

  • f the attribute on acceptability for the individual respondent

Data analysis

 The impact score for each attribute =mean acceptability score of the four scenarios with the preferred value - mean acceptability score of the four scenarios with the non-preferred value  Impact of an attribute =average of the individual impact scores across respondents  One-sample t-test to determine the statistical significance of the impact of each attribute

Data analysis

 Explore the relationship between decision making with

 Demographic characteristics: age, gender, education, title, duration

  • f service

 Hospital characteristics: size, level, and type of hospital, HIV caseload, provision of HIV-related services  Perception of the WW intervention: relevance, relative advantage, simplicity  Perception of inner setting: organizational readiness to change, available resources  Perception of the outer setting: policy, availability of technical support

Data analysis

 Originally a computer simulation method, and later used in healthcare management studies  Aim:

 To identify the weak links (bottlenecks) in improving universal precaution (UP) compliance among service providers  To provide information for choosing a specific way to remove such bottleneck

Bottleneck analysis

slide-6
SLIDE 6

10/28/2014 6

 Bottleneck analysis is a case-oriented approach, with each hospital being a case.  12 hospitals

 Two provincial level hospitals, 4 city level hospitals and 6 county level hospitals  ½ general hospitals; and ½ specialized hospitals

Study hospitals

 Predetermined based on literature review and prior knowledge

  • f hospital system

 Focus group will be conducted with hospital stakeholders to determine the hospital-specific UP throughput in a graphical way

Links of universal precaution

The hospital level availability of UP supplies Distribution of UP supplies to each department Accessibility of UP supplies among service providers Utilization of UP supplies among service providers Correct usage of UP supplies among service providers

 Hospital stakeholder focus group and hospital stock documentations

 Hospital budget for UP supplies, channel of replenish, and the price for UP supplies  Allocation of UP supplies in each department, and the actual amount of supplies that is needed

 Service provider survey and staff observation

 Amount of UP supplies needed/fulfilled  UP compliance  Correct usage of UP supply

Data collection

 Estimate the proportion of fulfillment through each link of the throughput, using a Microsoft Excel-based spread-sheet.  The link(s) with the least throughput rate will be identified as system “bottlenecks”

 For example, in a certain hospital:

The availability of UP supplies is 50% at the hospital level 80% of the supplies are timely distributed to the departments The actual access to the supplies is 40% fulfilled About 10% of the providers actually used the supplies Among whom 80% used the supplies correctly

 What-if analysis will be conducted to examine the impact of hypothetical changes in UP throughput

Data analysis

BOTTLENECK

slide-7
SLIDE 7

10/28/2014 7

 Implementation science

 Laura J Damschroder et al. 2009. Fostering implementation of health services research findings into practice: a consolidated framework for advancing implementation science. Implementation Science 2009, 4:50.

 Conjoint analysis

 Bridges JF, Hauber AB, Marshall D, Lloyd A, Prosser LA, Regier DA, et al. Conjoint analysis applications in health--a checklist: a report of the ISPOR Good Research Practices for Conjoint Analysis Task Force. Value Health. 2011;14(4):403- 13.  Lee SJ, Newman PA, Comulada WS, Cunningham WE, Duan N. Use of conjoint analysis to assess HIV vaccine acceptability: feasibility of an innovation in the assessment of consumer health-care preferences. Int J STD AIDS. 2012;23(4):235-41.  Newman PA, Lee SJ, Duan N, Rudy E, Nakazono TK, Boscardin J, et al. Preventive HIV vaccine acceptability and behavioral risk compensation among a random sample of high-risk adults in Los Angeles (LA VOICES). Health Serv

  • Res. 2009;44(6):2167-79.

 Plackett RL, Burman JP. The design of optimum multifactorial experiments. Biometrika. 1946;33(4):305-25.  %MktEx Macro. http://support.sas.com/techsup/technote/mr2010mktex.pdf

 Bottleneck analysis

 The Wharton School, The University of Pennsylvania. OPIM 631-Operations Management: Quality and Productivity. Note on Process Analysis. http://opim.wharton.upenn.edu/~ulrich/downloads/processanalysis.pdf  Wang J, Quan S, Li J, Hollis AM. Modeling and analysis of work flow and staffing level in a computed tomography division of University of Wisconsin Medical Foundation. Health Care Manag Sci. 2012;15(2):108-20.

References

 Funding Sources:

 NIMH K01MH102147  NIMH R01MH081778

 Collaborators:

 National Center for AIDS/STD Control & Prevention, China Center for Disease Control and Prevention  Fujian Center for Disease Control and Prevention

 Special thanks

 Li Li, Ph.D. the primary mentor of the K award  Sung-Jae Lee, Ph.D. for guidance in conjoint analysis

Acknowledgement

Thank you!