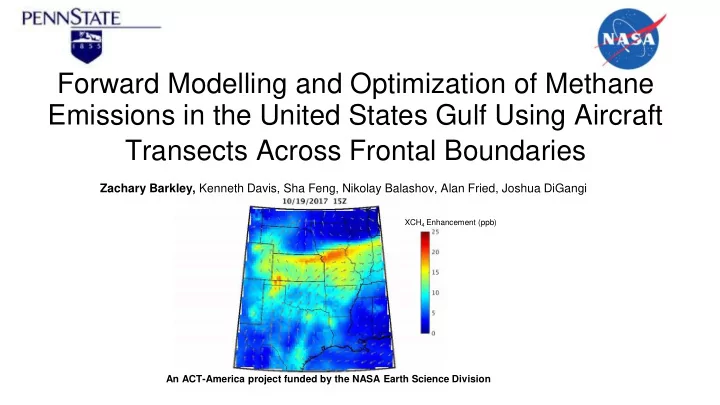
SLIDE 1 Forward Modelling and Optimization of Methane Emissions in the United States Gulf Using Aircraft Transects Across Frontal Boundaries
Zachary Barkley, Kenneth Davis, Sha Feng, Nikolay Balashov, Alan Fried, Joshua DiGangi
An ACT-America project funded by the NASA Earth Science Division
XCH4 Enhancement (ppb)
SLIDE 2
Spring 2018 Fall 2017 Winter 2017 Summer 2016
Shameless ACT-America Plug
SLIDE 3
Oct 18, 2017 Oct 21, 2017
Observed Boundary Layer Methane (ppm)
SLIDE 4
SLIDE 5
40% of anthropogenic methane emissions in the US
SLIDE 6
Southerly winds begin 2 days of steady state Plume converges at front
SLIDE 7 Optimization of Methane Sources: Oct 18th, 2017
Oil and Gas Everything else
CH4 Enhancement (ppm)
Animal Agriculture
SLIDE 8
Oct 18, 2017 Original Oct 18, 2017 Optimized CH4 Enhancement (ppm)
Optimization of Methane Sources: Oct 18th
SLIDE 9
SLIDE 10
Ethane Optimization r=0.89 :) r=0.80 :( r=0.89 :)
We’re really good at recreating the total methane plume
SLIDE 11
...but not so great with knowing which source to attribute it to.
SLIDE 12
Major methane sources in the Gulf
SLIDE 13
Major ethane sources in the Gulf
SLIDE 14
SLIDE 15 Methane Enhancement (ppm)
10/21/2017 20:00Z
10/21/2017
Ethane Enhancement (ppb)
SLIDE 16
Ethane Optimization r=0.80
SLIDE 17
SLIDE 18
0.06
0.80
~0.00
Methane (ppm) Ethane (ppm) Animal Ag O&G mix ???????
10/21/2017
SLIDE 19 Animal Agriculture ends up at 1
SLIDE 20 Conclusions:
- Frontal weather events may be useful at quantifying emissions from various
sources.
- There’s more methane in these frontal flights than is in the EPA’s gridded methane
inventory.
- High ethane values indicate that the O&G sector is likely responsible for this
discrepancy (factor of 2 increase). No evidence that animal agriculture deviates from inventory estimates.
SLIDE 21
Spring 2018 Fall 2017 Winter 2017 Summer 2016
Shameless ACT-America Plug
SLIDE 22