
SLIDE 1
Ground-Based Measurements of Ethane to Methane Ratios in the Barnett - - PowerPoint PPT Presentation
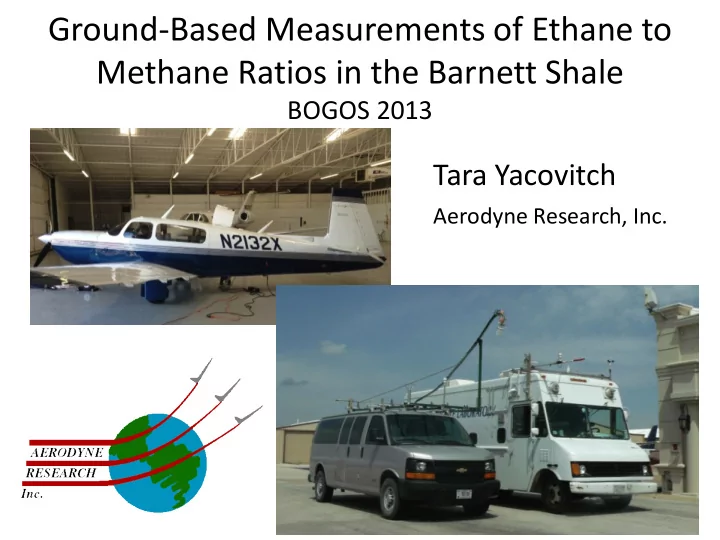
Ground-Based Measurements of Ethane to Methane Ratios in the Barnett Shale BOGOS 2013 Tara Yacovitch Aerodyne Research, Inc. Methane and Ethane Wind from SSW 160 5 m/s Biogenic vs Thermogenic Methane 7% Aerodynes Ethane Mini: Direct
7%
One or two football fields of length folded into absorption cell
Synthetic ray-trace simulations compared to digitized spot photos of a visible trace beam further corroborate light propagation along a known path through the multipass cell
Northern Texas
Bridgeport Processing Facility Producing Wells South of Decatur More wells near Rhome
by source