
SLIDE 1
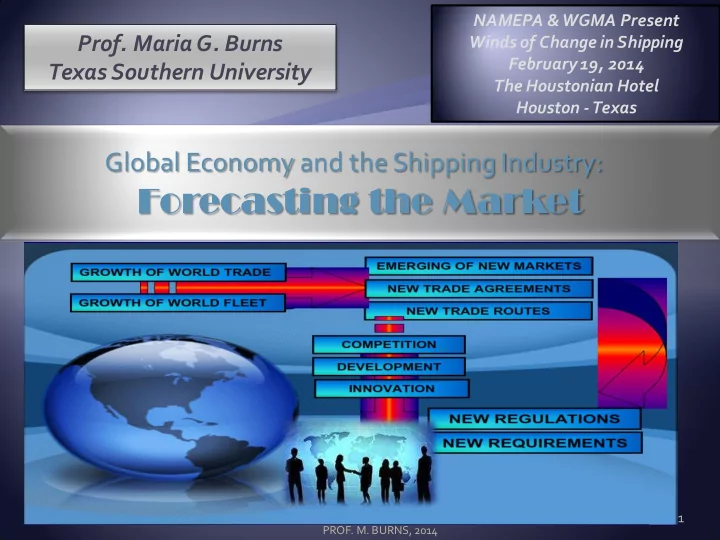
Global Economy and the Shipping Industry:
Forecasting the Market
1
- PROF. M. BURNS, 2014
- Prof. Maria G. Burns
Forecasting the Market 1 PROF. M. BURNS, 2014 2014 FORECAST! 80% - - PowerPoint PPT Presentation
NAMEPA & WGMA Present Prof. Maria G. Burns Winds of Change in Shipping February 19, 2014 Texas Southern University The Houstonian Hotel Houston - Texas Global Economy and the Shipping Industry: Forecasting the Market 1 PROF. M. BURNS,
1
MGB 2014
2
THE MANY FACES OF THE
MGB 2014
3
4
MGB 2014
5
SOURCE: M. BURNS - PORT MANAGEMENT AND OPERATIONS.*. CRC , 2014.
6
Source: M.BURNS - PORT MANAGEMENT AND OPERATIONS.*. CRC Press, Taylor & Francis Group
MGB 2014
7
MGB 2014
8
$77.00 $78.00 $79.00 $80.00 $81.00 $82.00 $83.00 $84.00 0.5 1 1.5 2 2.5 3 3.5
0.00% 1.00% 2.00% 3.00% 4.00% 5.00% 6.00% 1 2 3
$11,700 $11,800 $11,900 $12,000 $12,100 $12,200 $12,300 $12,400 $12,500 $12,600 1 2 3
MGB 2014
9
10
SOURCE: M. BURNS - PORT MANAGEMENT AND OPERATIONS.*. CRC Press, Taylor & Francis Group based on data from US Bureau Of Economic Analysis. 1980-2013,and China NBS, 2013.
100000 200000 300000 400000 500000 600000 700000 ASIA Shanghai, China Hong Kong, China Dalian, China Shenzhen, China Ningbo, China Guangzhou, China Quingdao, China QuinHUANdao,… Tianjin, China Rizhao, China Yingkou, China Nantong, China Xiamen, China Tokyo, Japan Yokohama, Japan Chiba, Japan Nagoya, Japan Kwangyang, S.… Busan, S. Korea Ulsan, S. Korea Inchon, S. Korea Port Kelang,… Kaohsiung, Taiwan OCEANIA Newcastle,… Port Hedland,… Dampier, Australia 2003 2007 2008 2011
MGB 2014
11
Figure 2.3 World’s Leading Ports: 2003-2013
Source: the Author based on data from World Shipping Council (2013), IMF (2013), Agência Nacional de Transportes Aquaviários - ANTAQ(Brazil), Institute of Shipping Economics & Logistics, Containerisation International Yearbook 2012; U.S. ArmCommerce Statistics Center, Secretariat of Communications and Transport (Mexico), Waterborne Transport Institute (China); AAPA Surveys ; and various port internet sites (2003-2013).
100,000 200,000 300,000 400,000 500,000 600,000 700,000 1 2 3 4 5 Shanghai, China Singapore, Singapore Tianjin, China Rotterdam, Netherlands Guangzhou, China Quingdao, China Ningbo, China QuinHUANdao, China Busan, S. Korea Hong Kong, China Port Hedland, Australia South Louisiana, LA, USA Houston, USA Dalian, China Shenzhen, China Port Kelang, Malaysia Antwerp, Belgium Nagoya, Japan MGB 2014
12
MGB 2014
13
14
MB, NAMEPA 2014
Millions
Used Oil from Land, Municipal & Industrial Waste
363
137
92
62
37
15
210
MGB 2014
15
16
MB, NAMEPA 2014
While the sources of anthropogenic (man-made) pollution receive considerable publicity, little is known of the naturally spilled oil and gas that the seas have been receiving and absorbing for 400 million years.
Non- Anthropogenic Pollution: Natural Seeps 60%
Anthropogenic Pollution: Extraction 2% Anthropogenic Pollution: Transportation, Refining, Distribution 4% Anthropogenic Pollution: Energy Consumption 34%
Source: compiled by M. Burns, based on data from Bureau of Ocean Energy Management, 2009 (w ww.boem.gov) and National Research Council, “Oil in the Sea” 2003 (w ww.nap.gov)
17
MB, NAMEPA 2014
MB, DOT 2013
18
TRANSPORTATION
MGB 2014
19
PRODUCTION : industrial zone, refineries. DISTRIBUTION CENTERS, Mass Storage Areas. TRANSPORTATION
MGB 2014
20
POLITICAL, MILITARY, ECONOMIC CENTERS
DISTRIBUTION CENTERS, Mass Storage Areas.
TRANSPORTATION I.T.
MB, DOT 2013
21
MGB 2014
22
Table: World seaborne trade in 2006-2012
LOADED UNLOADED
Year
Total
Crude Petroleum products and gas Dry cargo Total Crude Petroleum products and gas Dry cargo
2006 7,700.30 1,783.40 914.8 5,002.10 7,878.30 1,931.20 893.7 5,053.40 2007 8,034.10 1,813.40 933.5 5,287.10 8,140.20 1,995.70 903.8 5,240.80 2008 8,229.50 1,785.20 957 5,487.20 8,286.30 1,942.30 934.9 5,409.20 2009 7,858.00 1,710.50 931.1 5,216.40 7,832.00 1,874.10 921.3 5,036.60 2010 8,408.90 1,787.70 983.8 5,637.50 8,443.80 1,933.20 979.2 5,531.40 2011 8,747.70 1,762.40 1,033.50 5,951.90 8,769.30 1,907.00 1,038.60 5,823.70 2012 9,165.00 1,785.40 1,050.90 6,329.00 9,183.70 1,928.70 1,054.90 6,200.10
Sources: UNCTAD, Review of Maritime Transport, 2012, based on data supplied by reporting countries and as published on the relevant government, port industry websites and other specialist websites and sources.
MGB 2014
23
06 07 08 09 10 11 12 06 07 08 09 10 11 12
CARGO LOADED CARGO UNLOADED
SOURCE: M. BURNS - PORT MANAGEMENT AND OPERATIONS.*. CRC Press, Taylor & Francis Group based on data from UNCTAD Statistics, 1980 - 2013
MGB 2014
24
GLOBAL FLEET CARGO UNLOADED
06 07 08 09 10 11 12
SOURCE: M. BURNS - PORT MANAGEMENT AND OPERATIONS.*. CRC Press, Taylor & Francis Group based on data from UNCTAD Statistics, 1980 - 2013
80 81 82 83 84 85 86 87 88 89 90 91 92 93 94 95 96 97 98 99 00 01 02 03 04 05 06 07 08 09 10 11 12 13
25
PORT MANAGEMENT AND OPERATIONS.* M. BURNS . CRC Press, Taylor & Francis Group
1980 1985 1990 1995 2000 2005 2008 2009 2010 2011 2012 Oil & Gas 1,871 1,459 1,755 2,050 2,163 2,422 2,742 2,642 2,772 2,796 3,033 5 major bulks * 608 900 988 1,105 1,295 1,709 2,065 2,085 2,335 2,477 2,547 Other dry cargo 1,123 819 1,031 1,125 1,928 2,009 2,173 2,004 2,027 2,090 2,219 Container 102 152 234 371 598 909 1,249 1,127 1,275 1,385 1,498 Source: Compiled by UNCTAD, 1980 – 2013 UNCTAD review of maritime transport 1980 – 2013
* coal, alumina-bauxite, grain and oilseeds, iron ore, phosphate
26
MB, NAMEPA 2014
Compiled based on www.data.bsee.gov, 2013
85-86-87-88-89-90-91-92-93-94-95-96-97-98-99-00-01-02-03-04-05-06-07-08-09-10-11-12
Year Oil Gas 1985 6.009 0.834 1986 5.365 0.912 1987 5.211 0.978 1988 4.31 0.835 1989 3.564 0.687 1990 4.421 0.621 1991 7.764 1.241 1992 12.23 1.876 1993 11.91 2.575 1994 13.3 3.306 1995 15.99 3.788 1996 19.57 5.48 1997 26.36 7.419 1998 35.84 11.1 1999 45.45 16.71 2000 51.84 20.14 2001 56.44 23.28 2002 61.38 28.43 2003 62.36 32.19 2004 64.99 34.85 2005 69.72 37.7 2006 72.3 37.43
2007 70.1 36.51
2008 73.85 42.86 2009 80.22 44.99 2010 81.28 47.32
2011 78.55 46.77 2012 79.09 47.22
27
Source: M.BURNS - PORT MANAGEMENT AND OPERATIONS.*. CRC Press, Taylor & Francis Group
28
Source: M.BURNS - PORT MANAGEMENT AND OPERATIONS.*. CRC Press, Taylor & Francis Group
29
Source: M.BURNS - PORT MANAGEMENT AND OPERATIONS.*. CRC Press, Taylor & Francis Group
30
Source: M.BURNS - PORT MANAGEMENT AND OPERATIONS.*. CRC Press, Taylor & Francis Group
MGB 2014
31
32
Source: M.BURNS - PORT MANAGEMENT AND OPERATIONS.*. CRC Press, Taylor & Francis Group
33
34