
SLIDE 1
Folsom Cordova Unified School District Introduction to Districting - - PowerPoint PPT Presentation
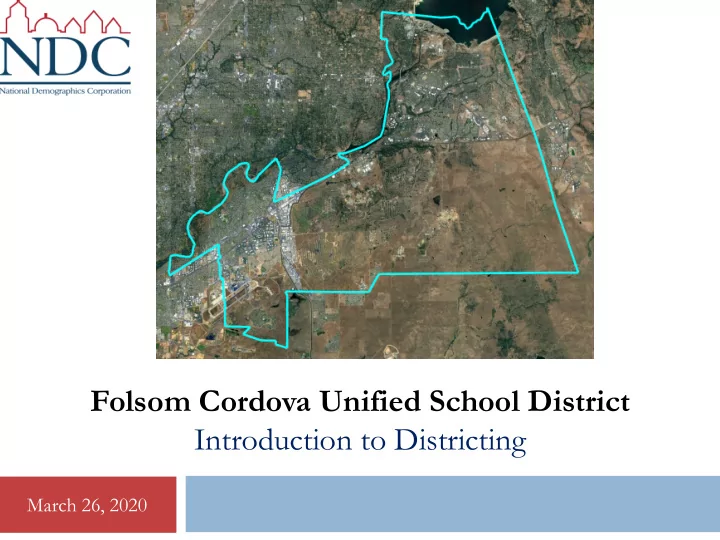
Folsom Cordova Unified School District Introduction to Districting March 26, 2020 Districting Rules 2 Federal Laws Traditional Redistricting Principles Communities of interest Equal Population Compact Federal Voting Rights Act
Equal Population Federal Voting Rights Act No Racial Gerrymandering Communities of interest Compact Contiguous Visible (Natural & man-made)
Respect voters’ choices /
Planned future
2
March 26, 2020
Category Field Count Pct Category Field Count Pct Total Pop 115,536 ACS Pop. Est. Total 123,640 Hisp 16,642 14% age0-19 32,778 27% NH White 73,093 63% age20-60 67,784 55% NH Black 6,654 6% age60plus 23,078 19% Asian-American 15,684 14% immigrants 24,333 20% Total 82,780 naturalized 12,876 53% Hisp 9,834 12% english 85,175 73% NH White 56,315 68% spanish 9,830 8% NH Black 4,297 5% asian-lang 9,848 8% Asian/Pac.Isl. 285 1%
11,234 10% Total 66,594 Language Fluency Speaks Eng. "Less than Very Well" 11,307 10% Latino est. 6,949 10% hs-grad 42,932 51% Spanish-Surnamed 6,243 9% bachelor 22,509 27% Asian-Surnamed 3,925 6% graduatedegree 13,248 16% Filipino-Surnamed 939 1% Child in Household child-under18 15,220 33% NH White est. 51,290 77% Pct of Pop. Age 16+ employed 60,150 62% NH Black 3,595 5% income 0-25k 5,944 13% Total 47,166 income 25-50k 7,665 17% Latino est. 4,383 9% income 50-75k 7,010 15% Spanish-Surnamed 3,938 8% income 75-200k 19,870 43% Asian-Surnamed 2,558 5% income 200k-plus 5,400 12% Filipino-Surnamed 667 1% single family 35,817 75% NH White est. 37,258 79% multi-family 11,860 25% NH Black 2,371 5% rented 17,235 38% Total 52,514
28,654 62% Latino est. 4,939 9% Spanish-Surnamed 4,437 8% Asian-Surnamed 2,663 5% Filipino-Surnamed 691 1% NH White est. 40,930 78% NH Black est. 2,816 5% Housing Stats Household Income Education (among those age 25+) Total Pop Immigration Citizen Voting Age Pop Age Voter Registration (Nov 2018) Voter Turnout (Nov 2018) Voter Turnout (Nov 2016) Language spoken at home
March 26, 2020
3
Each of the five trustee areas must contain about 23,107 residents.
Total population data from the 2010 Decennial Census. Surname-based Voter Registration and Turnout data from the California Statewide Database. Latino voter registration and turnout data are Spanish-surname counts adjusted using Census Population Department undercount estimates. NH White and NH Black registration and turnout counts estimated by NDC. Citizen Voting Age Population, Age, Immigration, and other demographics from the 2014-2018 American Community Survey and Special Tabulation 5-year data.
Data e excludes the pr prison po n popu pulation. n.
March 26, 2020
4
Lat atinos ar are not p par articular arly concentrated anywhere in t the District.
These two red Census Blocks contain a total of only 6 people.
March 26, 2020
5
Af African-Americans are n not particularly c concentrated anywhere in in the D e Dis istrict ict.
March 26, 2020
6
Asia sian-Americans are s somewhat conc ncent ntrated in S n SE F Folsom and nd Rancho C
sou
March 26, 2020
Such as similar levels of income, education, or linguistic isolation
7
March 26, 2020
8
March 26, 2020
9
March 26, 2020
10
March 26, 2020
11
1.
2.