
SLIDE 1
A vision for a m ore resilient Iow a
T he Iow a Wat ershed Approach
A vision for a m ore resilient Iow a
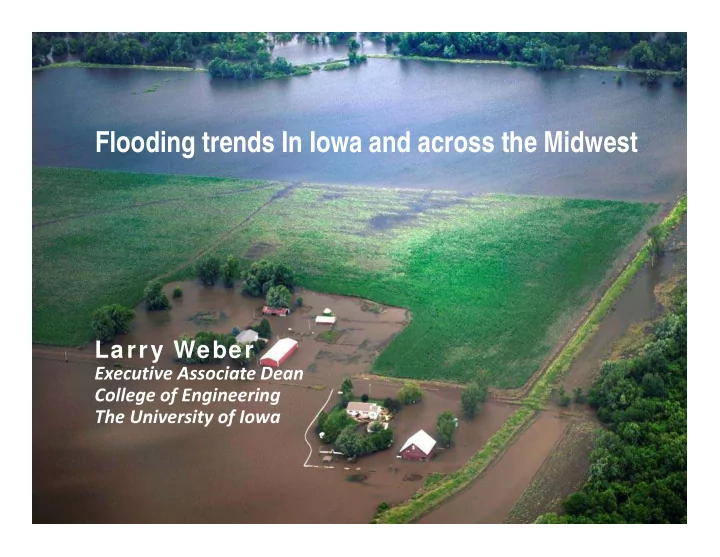
Flooding trends In Iowa and across the Midwest Larry Weber Executive - - PowerPoint PPT Presentation
A vision for a m ore resilient Iow a A vision for a m ore resilient Iow a T he Iow a Wat ershed Approach T he Iow a Wat ershed Approach Flooding trends In Iowa and across the Midwest Larry Weber Executive Associate Dean College of Engineering
A vision for a m ore resilient Iow a
A vision for a m ore resilient Iow a
A vision for a m ore resilient Iow a
A vision for a m ore resilient Iow a
A vision for a m ore resilient Iow a
A vision for a m ore resilient Iow a
A vision for a m ore resilient Iow a
A vision for a m ore resilient Iow a
A vision for a m ore resilient Iow a
A vision for a m ore resilient Iow a
(b) (c)
A vision for a m ore resilient Iow a
A vision for a m ore resilient Iow a
Q100 = 26,350 cfs
A vision for a m ore resilient Iow a
Q500 = 35,800 cfs
A vision for a m ore resilient Iow a
A vision for a m ore resilient Iow a
A vision for a m ore resilient Iow a
A vision for a m ore resilient Iow a
A vision for a m ore resilient Iow a
A vision for a m ore resilient Iow a
drone video by Jewellable Productions
A vision for a m ore resilient Iow a
A vision for a m ore resilient Iow a
drone video by Jewellable Productions
A vision for a m ore resilient Iow a
A vision for a m ore resilient Iow a
A vision for a m ore resilient Iow a
A vision for a m ore resilient Iow a
A vision for a m ore resilient Iow a
A vision for a m ore resilient Iow a
A vision for a m ore resilient Iow a
A vision for a m ore resilient Iow a
A vision for a m ore resilient Iow a
A vision for a m ore resilient Iow a
A vision for a m ore resilient Iow a
A vision for a m ore resilient Iow a
A vision for a m ore resilient Iow a
A vision for a m ore resilient Iow a
A vision for a m ore resilient Iow a
Iowa Flood Center The University of Iowa 100 C. Maxwell Stanley Hydraulics Laboratory Iowa City, IA 52242 319-384-1729 www.iowafloodcenter.org
26