
SLIDE 1
FIU BeyondPossible 2020 FIU will have a transformative impact on our - - PowerPoint PPT Presentation
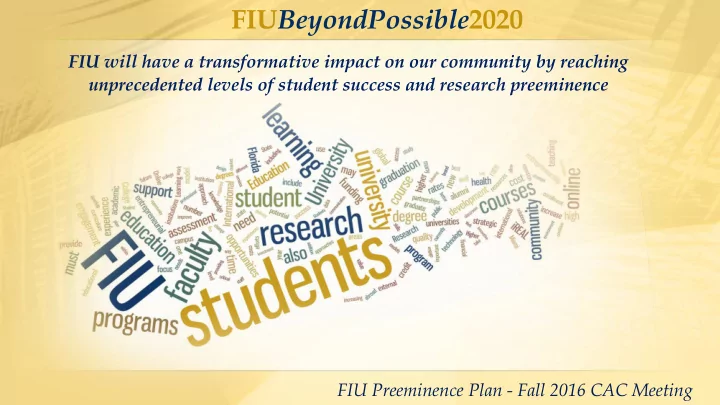
FIU BeyondPossible 2020 FIU will have a transformative impact on our community by reaching unprecedented levels of student success and research preeminence FIU Preeminence Plan - Fall 2016 CAC Meeting From Carnegie R1 to BOG Preeminence On
99 95 92 82 137 134 131 119
80 90 100 110 120 130 140
2012 2013 2014 2015
Public All
FIU Ranking
# BOG Preeminent Research Univ. Metric BENCH- MARKS 2016 ACTUAL 1 Average GPA and SAT Score for incoming freshman in Fall semester 4.0 GPA 1200 SAT 3.9 1120 2 Public University National Ranking in more than one national ranking Top 50 1 3 Freshman Retention Rate Full-time, FTIC 90% 87% 4 6-year Graduation Rate Full-time, FTIC 70% 58% 5 National Academy Memberships 6 1 6 Science & Engineering Research Expenditures ($M) $200 M $125 7 Non-Medical Science & Engineering Research Expenditures ($M) $150 M $116 8 National Ranking in S.T.E.M. Research Expenditures (in 5 of 8 disciplines) Top 100 4 of 8 9 Patents Awarded over 3 years 100 11 10 10 Doctoral Degrees Awarded Annually 400 327 11 11 Number of Post-Doctoral Appointees 200 55 12 12 Endowment Size ($M) $500 M $179
# BOG Preeminent Research Univ. Metric BENCH- MARKS 2016 ACTUAL 2017 GOALS 1 Average GPA and SAT Score for incoming freshman in Fall semester 4.0 GPA 1200 SAT 3.9 1120 3.95 1140 2 Public University National Ranking in more than one national ranking Top 50 1 1 3 Freshman Retention Rate Full-time, FTIC 90% 87% 88% 4 6-year Graduation Rate Full-time, FTIC 70% 58% 53.5% 5 National Academy Memberships 6 1 2 6 Science & Engineering Research Expenditures ($M) $200 M $125 $130 7 Non-Medical Science & Engineering Research Expenditures ($M) $150 M $116 $122 8 National Ranking in S.T.E.M. Research Expenditures (in 5 of 8 disciplines) Top 100 4 of 8 5 of 8 9 Patents Awarded over 3 years 100 11 15 10 10 Doctoral Degrees Awarded Annually 400 327 326 11 11 Number of Post-Doctoral Appointees 200 55 205 12 12 Endowment Size ($M) $500 M $179 $225
30 40 50 60 70 80 90 100 110 120 130 2012 2013 2014 2015 Computer Science
FIU Ranking
Psychology Environmental Sci Social Sciences Engineering
90 110 130 150 170 190 210 230
2012 2013 2014 2015 FIU Ranking
# BOG Preeminent Research Univ. Metric BENCH- MARKS 2016 ACTUAL 2017 GOALS 2018 GOALS 1 Average GPA and SAT Score for incoming freshman in Fall semester 4.0 GPA 1200 SAT 3.9 1120 3.95 1140 4.00 1200 2 Public University National Ranking in more than one national ranking Top 50 1 1 1 3 Freshman Retention Rate Full-time, FTIC 90% 87% 88% 90% 4 6-year Graduation Rate Full-time, FTIC 70% 58% 53.5% 55.5% 5 National Academy Memberships 6 1 2 3 6 Science & Engineering Research Expenditures ($M) $200 M $125 $130 $153 7 Non-Medical Science & Engineering Research Expenditures ($M) $150 M $116 $122 $134 8 National Ranking in S.T.E.M. Research Expenditures (in 5 of 8 disciplines) Top 100 4 of 8 5 of 8 5 of 8 9 Patents Awarded over 3 years 100 11 15 29 10 10 Doctoral Degrees Awarded Annually 400 327 326 337 11 11 Number of Post-Doctoral Appointees 200 55 205 210 12 12 Endowment Size ($M) $500 M $179 $225 $250
# BOG Preeminent Research Univ. Metric BENCH- MARKS 2016 ACTUAL 2017 GOALS 2018 GOALS 2019 GOALS 1 Average GPA and SAT Score for incoming freshman in Fall semester 4.0 GPA 1200 SAT 3.9 1120 3.95 1140 4.00 1200 4.05 1220 2 Public University National Ranking in more than one national ranking Top 50 1 1 1 1 3 Freshman Retention Rate Full-time, FTIC 90% 87% 88% 90% 91% 4 6-year Graduation Rate Full-time, FTIC 70% 58% 53.5% 55.5% 63.5% 5 National Academy Memberships 6 1 2 3 4 6 Science & Engineering Research Expenditures ($M) $200 M $125 $130 $153 $171 7 Non-Medical Science & Engineering Research Expenditures ($M) $150 M $116 $122 $134 $150 8 National Ranking in S.T.E.M. Research Expenditures (in 5 of 8 disciplines) Top 100 4 of 8 5 of 8 5 of 8 5 of 8 9 Patents Awarded over 3 years 100 11 15 29 55 10 10 Doctoral Degrees Awarded Annually 400 327 326 337 400 11 11 Number of Post-Doctoral Appointees 200 55 205 210 215 12 12 Endowment Size ($M) $500 M $179 $225 $250 $275
# BOG Preeminent Research Univ. Metric BENCH- MARKS 2016 ACTUAL 2017 GOALS 2018 GOALS 2019 GOALS 2020 GOALS 1 Average GPA and SAT Score for incoming freshman in Fall semester 4.0 GPA 1200 SAT 3.9 1120 3.95 1140 4.00 1200 4.05 1220 4.10 1240 2 Public University National Ranking in more than one national ranking Top 50 1 1 1 1 1 3 Freshman Retention Rate Full-time, FTIC 90% 87% 88% 90% 91% 92% 4 6-year Graduation Rate Full-time, FTIC 70% 58% 53.5% 55.5% 63.5% 70% 5 National Academy Memberships 6 1 2 3 4 5 6 Science & Engineering Research Expenditures ($M) $200 M $125 $130 $153 $171 $187 7 Non-Medical Science & Engineering Research Expenditures ($M) $150 M $116 $122 $134 $150 $163 8 National Ranking in S.T.E.M. Research Expenditures (in 5 of 8 disciplines) Top 100 4 of 8 5 of 8 5 of 8 5 of 8 6 of 8 9 Patents Awarded over 3 years 100 11 15 29 55 75 10 10 Doctoral Degrees Awarded Annually 400 327 326 337 400 410 11 11 Number of Post-Doctoral Appointees 200 55 205 210 215 220 12 12 Endowment Size ($M) $500 M $179 $225 $250 $275 $300
# BOG Preeminent Research Univ. Metric BENCH- MARKS 2016 ACTUAL 2017 GOALS 2018 GOALS 2019 GOALS 2020 GOALS 2021 GOALS 1 Average GPA and SAT Score for incoming freshman in Fall semester 4.0 GPA 1200 SAT 3.9 1120 3.95 1140 4.00 1200 4.05 1220 4.10 1240 4.15 1260 2 Public University National Ranking in more than one national ranking Top 50 1 1 1 1 1 2* 3 Freshman Retention Rate Full-time, FTIC 90% 87% 88% 90% 91% 92% 92% 4 6-year Graduation Rate Full-time, FTIC 70% 58% 53.5% 55.5% 63.5% 70% 70% 5 National Academy Memberships 6 1 2 3 4 5 6 6 Science & Engineering Research Expenditures ($M) $200 M $125 $130 $153 $171 $187 $203 7 Non-Medical Science & Engineering Research Expenditures ($M) $150 M $116 $122 $134 $150 $163 $178 8 National Ranking in S.T.E.M. Research Expenditures (in 5 of 8 disciplines) Top 100 4 of 8 5 of 8 5 of 8 5 of 8 6 of 8 7 of 8 9 Patents Awarded over 3 years 100 11 15 29 55 75 105 10 10 Doctoral Degrees Awarded Annually 400 327 326 337 400 410 420 11 11 Number of Post-Doctoral Appointees 200 55 205 210 215 220 220 12 12 Endowment Size ($M) $500 M $179 $225 $250 $275 $300 $325
* Washington Monthly, Kiplinger’s Best College Values
1 2 3 5 16 10 14 31 30 34 45 5 10 15 20 25 30 35 40 45 50 2012 2013 2014 2015 2016 2017 2018 2019 2020 2021 Patents Issued Projections (75% Success) *In 2015, the university with 25 patents was ranked 100 worldwide (22 in 2014, and 20 in 2013.
Projections based on System Work Plan UNIV 2016 ACTUAL 2017 GOAL 2018 GOAL 2019 GOAL 2020 GOAL
UF 82 88 87 87 88 UCF 84 82 84 85 87 UWF 57 81 70 70 76 FSU 68 79 74 76 79 USF 79 75 81 84 88 FAU 84 69 78 82 88 FGCU 67 68 69 73 74 FIU 76 66 76 88 93 NCF 59 65 68 72 73 UNF 56 63 61 65 65 FAMU 65 61 66 82 85
FIU # 8 based on 2017 Projections