
SLIDE 1
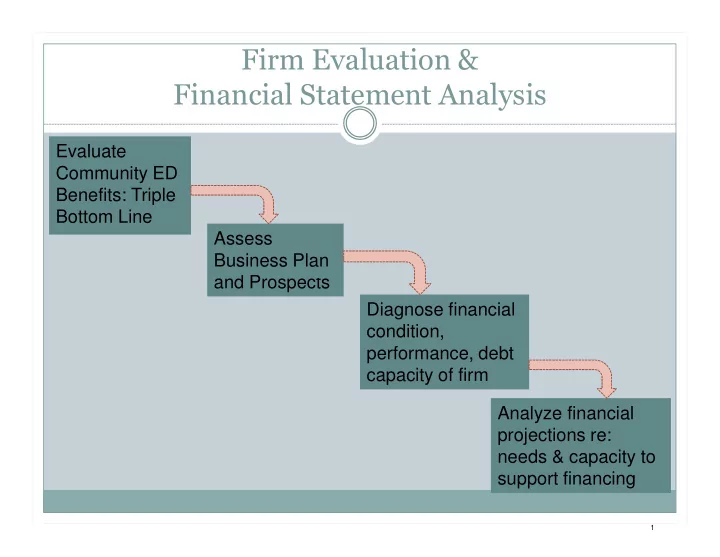
Firm Evaluation & Financial Statement Analysis
Evaluate Community ED Benefits: Triple Bottom Line Assess Business Plan d P and Prospects Analyze financial projections re: needs & capacity to support financing Diagnose financial condition, performance, debt capacity of firm
1