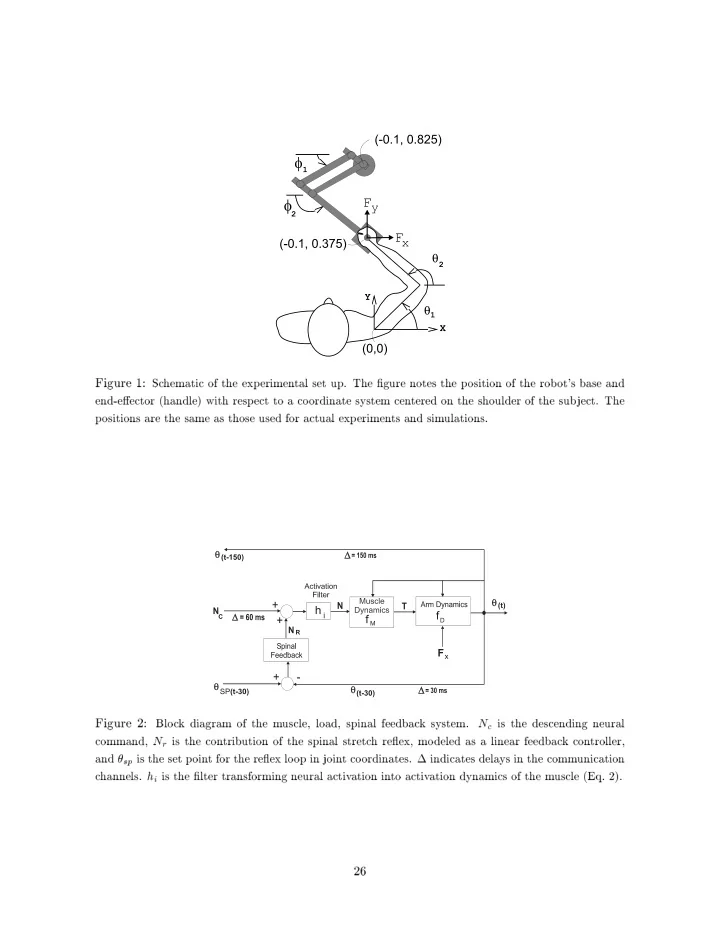
Figure 1: Sc hematic of the exp erimen tal set up. The - - PDF document

figure 1 sc hematic of the exp erimen tal set up the gure
SMART_READER_LITE
LIVE PREVIEW

Figure 1: Sc hematic of the exp erimen tal set up. The - - PDF document

Figure 1: Sc hematic of the exp erimen tal set up. The gure notes the p osition of the rob ot's base and end-eector (handle) with resp ect to a co ordinate system cen tered on the shoulder of the


slide-1
SLIDE 1

θ θ

Figure 1: Sc hematic
  • f
the exp erimen tal set up. The gure notes the p
  • sition
  • f
the rob
  • t's
base and end-eector (handle) with resp ect to a co
  • rdinate
system cen tered
  • n
the shoulder
  • f
the sub ject. The p
  • sitions
are the same as those used for actual exp erimen ts and sim ulations. Figure 2: Blo c k diagram
  • f
the m uscle, load, spinal feedbac k system. N c is the descending neural command, N r is the con tribution
  • f
the spinal stretc h reex, mo deled as a linear feedbac k con troller, and
  • sp
is the set p
  • in
t for the reex lo
  • p
in join t co
  • rdinates.
  • indicates
dela ys in the comm unication c hannels. h i is the lter transforming neural activ ation in to activ ation dynamics
  • f
the m uscle (Eq. 2). 26
slide-2
SLIDE 2

Inverse Muscle Model External Forces

0.5 1 1.5 2 0.1 0.2 0.3 0.4

(A2)

0.5 1 1.5 2 −0.1 0.1 0.2 0.3 0.4

(B2)

Time (sec) Time (sec) Hand Velocity (m/s)

(B1) (A1)

Figure 3: Blo c k diagram illustrating a feedforw ard con troller that utilizes an in v erse m uscle mo del for assignmen t
  • f
neural activ ations to the m uscles, without accoun ting for dynamics
  • f
the lim b. The gures in the middle ro w sho w sim ulation results
  • f
hand tra jectory in a n ull eld (A1) and in force eld B 1 (B1). Figures in the b
  • ttom
ro w are for the same t w
  • conditions,
except that they sho w v elo cit y
  • f
the hand for a mo v emen t to the b
  • ttom-most
target (at
  • 90
  • ).
The gra y line is v elo cit y in the direction parallel to the direction
  • f
target (i.e., along the y-axis
  • f
Fig. 1), and the blac k line is the v elo cit y in a direction p erp endicular to that
  • f
target (i.e., along the x-axis
  • f
Fig. 1). The resp
  • nse
  • f
the system to the unmo deled inertial dynamics
  • f
the lim b and to the force eld is en tirely due to spring-lik e nature
  • f
the m uscles and the feedbac k pro vided b y the spinal system. 27
slide-3
SLIDE 3

(A1) 0.5 1 1.5 2 0.1 0.2 0.3 0.4 Time (s) Hand Velocity (m/s) (A2) (B1) 0.5 1 1.5 2 −0.1 0.1 0.2 0.3 0.4 Time (s) Hand Velocity (m/s) (B2)

Figure 4: Blo c k diagram illustrating a feedforw ard con troller that utilizes an in v erse dynamics mo del
  • f
the inertial prop erties
  • f
the lim b, as w ell as an in v erse m uscle mo del, for assignmen t
  • f
neural activ ations to the m uscles. Figures in the middle ro w (A1 and A2) sho w hand tra jectory
  • f
the system in a n ull eld and in eld B 1 . Figures in the b
  • ttom
ro w (B1 and B2) sho w v elo cit y
  • f
the hand for a mo v emen t to the b
  • ttom-most
target. The gra y line is v elo cit y along the y-axis, and the blac k line is the v elo cit y along the x-axis. The resp
  • nse
  • f
the system to force eld is en tirely due to spring-lik e nature
  • f
the m uscles and the feedbac k pro vided b y the spinal system. 28
slide-4
SLIDE 4 Figure 5: T ra jectories are in eld B 2 after sub ject and con trollers had adapted to eld B 1 . (A) Hand tra jectories for the con troller
  • f
Fig. 4, where
  • nly
an in v erse mo del is used. (B) T ra jectories for a t ypical sub ject. (C) T ra jectories for a con troller corresp
  • nding
to Fig. 11 (switc h set to 1) whic h used a forw ard mo del in conjunction with an in v erse mo del. First ro w: hand paths for 8 mo v emen t directions. Second ro w: v elo cit y along the y-axis (gra y line, parallel to the direction
  • f
target) and x-axis (blac k line, p erp endicular to the direction
  • f
target) for a mo v emen t to w ard a target at
  • 90
  • .
Third ro w: hand sp eed and segmen tation p
  • in
ts S i for a mo v emen t to w ard
  • 90
  • .
F
  • urth
ro w: deriv ativ e
  • f
v elo cit y direction and corresp
  • nding
segmen tation p
  • in
ts for a mo v emen t to w ard
  • 90
  • .
Fifth ro w: segmen tation
  • f
the hand's tra jectory . 29
slide-5
SLIDE 5 Figure 6: T ra jectory c haracteristics during a reac hing mo v emen t to w ard the b
  • ttom
most target (-90
  • )
for 16 sub jects in force eld B 2 after adaptation to eld B 1 (middle bar, dark gra y). W e ha v e also plotted the results
  • f
29 sim ulations
  • f
in v erse mo del con troller (ligh t gra y , corresp
  • nding
to the con troller in Fig. 4) and 35 sim ulations
  • f
the forw ard-in v erse mo del feedbac k con troller (blac k, corresp
  • nding
to the con troller in Fig. 11, switc h set to 1) for the same mo v emen t. The tra jectory parameters refer to the segmen tation sho wn in Fig. 5.
  • i
is angle ab
  • ut
a segmen tation p
  • in
t, t i is the time to reac h the i-th segmen tation p
  • in
t, d i is the distance to the i-th segmen tation p
  • in
t, jv j i is the hand sp eed at the segmen tation p
  • in
t, and N s is the n um b er
  • f
segmen tation p
  • in
ts in the tra jectory . The v alue prin ted at the top
  • f
eac h bar triplet is the v alue at the mean for the highest bar in the triplet. Note that for
  • 1
, d 1 , and t 1 , i.e., the initial part
  • f
the mo v emen t, p erformance
  • f
b
  • th
con trollers v ery closely matc hes that
  • f
the exp erimen tal data. Ho w ev er, in later stages
  • f
the mo v emen t
  • nly
the forw ard mo del based con troller
  • f
Fig. 11 con tin ues to accurately predict the exp erimen tal data. Figure 7: Blo c k diagram sho wing ho w a forw ard mo del ^ f p
  • f
a non-linear system f p can b e used to construct an
  • bserv
er for a time-dela y ed nonlinear system where the state at time t is estimated from the measured state at time t
  • t
and the
  • rderly
cascade
  • f
descending commands N c from time t
  • t
to t. 30
slide-6
SLIDE 6 Figure 8: A con trol metho d that uses a forw ard mo del in m uscle co
  • rdinates.
The switc h is in p
  • sition
2 for feedbac k con trol using
  • nly
the forw ard mo del, and in p
  • sition
1 when a forw ard mo del is used in conjunction with an in v erse mo del.

x y G _ + G

Figure 9: A simple linear system that uses a forw ard mo del ^ G
  • f
system dynamics G. Note that y =x = 1=(1 + G)
  • ^
G 1 , i.e., the feedbac k lo
  • p
eectiv ely appro ximate an in v erse
  • f
the plan t dynamics. 31
slide-7
SLIDE 7

(A1) 0.5 1 1.5 2 0.1 0.2 0.3 Time (s) Hand Velocity (m/s) (A2) (B1) 0.5 1 1.5 2 −0.1 0.1 0.2 0.3 0.4 Time (s) (B2) (C1) 0.5 1 1.5 2 −0.1 0.1 0.2 0.3 Time (s) (C2)

Figure 10: A con trol sc heme that uses a forw ard mo del in join t co
  • rdinates.
The switc h is in p
  • sition
2 for con trol via
  • nly
the forw ard mo del (FM), and in p
  • sition
1 for con trol via b
  • th
the forw ard and in v erse mo dels (IM). Sim ulated tra jectories for switc h in p
  • sition
2. (A1 and A2) FM exp ects n ull eld, arm mo v es in the n ull eld, (B1 and B2) FM exp ects n ull eld, arm mo v es in force eld B 1 , (C1 and C2) FM exp ects B 1 , arm mo v es in B 1 . Hand paths are represen ted as dots (big gra y dots- actual; small blac k dots- desired) at 20 ms in terv als. Lo w er panel: hand v elo cit y along y-axis (gra y line) and x-axis (blac k line) for a mo v emen t to w ard
  • 90
  • .
Gains
  • n
the linear feedbac k error con troller, K p = 30 N.m/rad and K v = 3 N.m/rad/sec, w ere set at 1/2
  • f
the v alue for whic h the system w as marginally stable. Ev en with a p erfect forw ard mo del, the system is not able to follo w the desired tra jectory . 32
slide-8
SLIDE 8

(A1) 0.5 1 1.5 2 0.1 0.2 0.3 0.4 Time (s) Hand Velocity (m/s) (A2) (B1) 0.5 1 1.5 2 −0.1 0.1 0.2 0.3 0.4 Time (s) (B2) (C1) 0.5 1 1.5 2 0.1 0.2 0.3 0.4 Time (s) (C2)

Figure 11: A con trol sc heme that uses a forw ard mo del in hand co
  • rdinates.
The switc h is in p
  • sition
2 for feedbac k con trol via the forw ard mo del, and in p
  • sition
1 for con trol via b
  • th
the forw ard and in v erse mo dels. Sim ulated tra jectories for switc h in p
  • sition
2. (A) FM exp ects n ull eld, arm mo ving in the n ull eld, (B) FM exp ects n ull eld, arm mo v es in force eld B 1 , (C) FM exp ects B 1 , arm mo v es in B 1 . Hand paths represen ted as dots (big gra y dots- actual; small blac k dots- desired) at 20 ms in terv als. Lo w er panel: hand v elo cit y along y-axis (gra y line) and x-axis (blac k line) for a do wn w ard mo v emen t. Gains
  • n
the linear feedbac k error con troller, K p = 500 and K v = 50, w ere set at 1/2
  • f
the v alue for whic h the system w as marginally stable. Ev en with a p erfect forw ard mo del, the system is not able to follo w the desired tra jectory . 33
slide-9
SLIDE 9

(A1) 0.5 1 1.5 2 −0.2 −0.1 0.1 0.2 Time (s) Hand Velocity (m/s) (A2) (B1) 0.5 1 1.5 2 −0.2 −0.1 0.1 0.2 Time (s) (B2) (C1) 0.5 1 1.5 2 −0.1 0.1 0.2 0.3 Time (s) (C2)

Figure 12: Sim ulated tra jectories for the con troller
  • f
Fig. 11 (switc h set to 1) for mo v emen ts in eld B 2 for three dieren t states
  • f
adaptation
  • f
the in v erse mo del (IM) and the forw ard mo del (FM). (A) IM=B 1 , FM=B 1 . (B) IM=n ull eld, FM=B 1 . (C) IM=B 1 , FM=n ull eld. The term n ull implies that the mo del comp ensates for
  • nly
the inertial dynamics
  • f
the lim b. (1) Hand paths for eigh t mo v emen t directions represen ted as dots (big gra y dots are actual; small blac k dots are desired) at 20 ms in terv als. (2) Hand v elo cit y along y-axis (gra y line) and x-axis (blac k line) for a do wn w ard mo v emen t. Note that the segmen tation b eha vior and the high frequency in the resp
  • nse
  • f
the system are presen t regardless
  • f
the state
  • f
adaptation
  • f
the in v erse mo del. The segmen tation is presen t
  • nly
if the forw ard mo del has adapted. 34
slide-10
SLIDE 10

0.5 1 1.5 2 0.1 0.2 0.3 0.4 Time (s) Parallel Hand Velocity (m/s) (A) 0.5 1 1.5 2 −0.2 −0.1 0.1 0.2 Time (s) Perpendicular Hand Velocity (m/s) (C) (B) (D) (E) (F)

Figure 13: Sim ulation for con troller
  • f
Fig. 11 (switc h set to 1) for mo v emen ts in eld B 2 for a mo v emen t in a do wn w ard direction. The in v erse mo del correctly exp ects B 2 while the forw ard mo del exp ects B 1 . (A) Hand v elo cit y parallel to the direction
  • f
target for the actual tra jectory
  • f
the arm (gra y line), estimated tra jectory (blac k line, i.e.,
  • utput
  • f
the forw ard mo del), and desired tra jectory (dotted line). (B) hand paths for actual tra jectory (gra y dots) and estimated tra jectory (blac k dots). (C) Similar to (A), except a plot
  • f
the hand v elo cit y p erp endicular to the direction
  • f
target. (D)-(F) Desired, estimated and actual acceleration signals plotted as v ectors at 20 ms time p
  • in
ts
  • n
the actual hand tra jectory . The largest acceleration v ector in the three plots has a magnitude
  • f
4.6 m=s 2 and all
  • ther
v ectors are scaled relativ e to that. 35
slide-11
SLIDE 11

0.2 0.4 0.6 0.8 −0.4 −0.3 −0.2 −0.1 Time (s) Hand Velocity (m/s) (1) 0.2 0.4 0.6 0.8 −0.3 −0.2 −0.1 0.1 0.2 Time (s) Measured Hand Velocity (m/s) (2) 0.2 0.4 0.6 0.8 −0.3 −0.2 −0.1 Time (s) Estimated Hand Velocity (m/s) (3)

Figure 14: Sim ulation results for a mo v emen t do wn w ard for a condition where measuremen t
  • f
v elo cit y is noisy . (1) Actual hand path and v elo cit y p erp endicular to the direction
  • f
target (gra y) and parallel to the direction
  • f
target (blac k). (2) Hand path along with noisy measuremen ts
  • f
hand v elo cit y . (3) Estimated hand path and v elo cit y (output
  • f
the forw ard mo del). Estimated v elo cit y is v ery robust to measuremen t noise. 36
slide-12
SLIDE 12

0.55 0.6 0.65 0.7 0.75 Movement Time (s) 0.105 0.11 0.115 0.12 Movement Dist. (m) 1.08 1.1 1.12 1.14 1.16 Jerk Ratio 0.94 0.96 0.98 Correlation Coeff. −6 −5 −4 −3 −2 x 10

−3

Perp.Disp.(m) at 0.15s 0.03 0.04 0.05

  • Perp. Velocity Power

0.1002 0.1004 0.1006 d1 (m) 0.48 0.49 0.5 t1 (s) 0.02 0.04 0.06 λ2 (rad) 0.005 0.01 0.015 d2 (m) 0.1 0.15 0.2 0.25 t2(s) −0.4 −0.3 −0.2 −0.1 λ3 (rad) 100 200 300 400 500 1.6 1.8 2 2.2 NS 100 200 300 400 500 0.04 0.06 0.08 |v|SP1(m/s)

Movement number Movement number

Figure 15: Adaptation curv es for mo v emen t parameters for sim ulated mo v emen ts in eld B 1 for t w
  • cases
  • (1)
dotted line:
  • nly
the in v erse mo del adapts exp
  • nen
tially to B 1 at a rate
  • f
r im = 0:02; r f m = 0, (2) solid line:
  • nly
the forw ard mo del adapts to B 1 at a rate
  • f
r im = 0; r f m = 0:02. The desired tra jectory w as a 10 cm minim um jerk motion p erformed in 0.5 sec. Jerk ratio is the ratio
  • f
cum ulated squared jerk in a mo v emen t with resp ect to the minim um jerk p
  • ssible
for a mo v emen t
  • f
the same p eak sp eed. Correlation co ecien t is with resp ect to the minim um jerk motion. P erp endicular distance refers to the distance
  • f
the hand from the min jerk motion at 150 msec in to the mo v emen t. P erp. P
  • w
er refers to the p
  • w
er in the frequency sp ectrum
  • f
the v elo cit y
  • f
hand along a direction p erp endicular to the direction
  • f
target. d i , t i , and
  • i
, refer to the distance to, time to, and angle at the i-th segmen tation p
  • in
t. N s is the n um b er
  • f
segmen tation p
  • in
ts, and jv j sp1 is the hand sp eed at the rst segmen tation p
  • in
t. 37
slide-13
SLIDE 13

−2.5 −2 −1.5 −1 −3 −2 −1 0.03 0.04 0.05 0.06 log10 ( rIM ) log10 ( rFM ) Mean Normalized Error −2.5 −2 −1.5 −1 −3.5 −3 −2.5 −2 −1.5 −1 log10 ( rFM ) log10 ( rIM ) 0.02 0.03 0.04 0.05 0.06 0.07

Figure 16: Net normalized error in matc hing p erformance
  • f
the sim ulated adaptiv e con troller
  • f
Fig. 11 (switc h set to 1) with that
  • f
16 sub jects that practiced in eld B 1 for 572 mo v emen ts. The error for com binations
  • f
v e dieren t rates
  • f
adaptation
  • f
the forw ard mo del (r f m = 0:003; 0:01; 0:03; 0:1; :3) and six rates
  • f
in v erse mo del (r im = 0:0003; 0:003; 0:01; :03; 0:1; 0:3) are plotted. The region
  • f
min- im um error v alue is highligh ted b y the thic k blac k line in the t w
  • -dimensional
pro jection. Note that while the error surface is sharply dened in terms
  • f
the forw ard mo del, it is fairly at to v ariations in the learning rate
  • f
the in v erse mo del.

0.1 0.2 Movement Time (s) 0.01 0.02 0.03 Movement Dist. (m) 0.1 0.2 Jerk Ratio −0.06 −0.04 −0.02 Correlation Coeff. −6 −4 −2 2 x 10

−3 Perp.Disp.(m) at .15 s

0.01 0.02 0.03 0.04

  • Perp. Velocity Power

−4 −2 2 4 x 10

−3

d1 (m) −0.1 −0.05 t1 (s) −0.05 0.05 0.1 λ2 (rad) 5 10 15 20 x 10

−3

d2 (m) 0.1 0.2 t2(s) 200 400 −0.4 −0.2

3

λ (rad) 200 400 0.5 1 NS 200 400 0.02 0.04 0.06 |v|SP1(m/s)

Movement number Movement number

Figure 17: Adaptation curv es for mo v emen t parameters in eld B 1 for sim ulated mo v emen ts
  • f
an adapting con troller (blac k) with adaptation constan ts r f m = 0:01; r im = 0:01, and for exp erimen tal data from 16 sub jects (gra y) plotted as the mean and standard deviation. All v alues are represen ted as c hange in the mo v emen t parameter with resp ect to v alues recorded after sub jects/mo dels had adapted to mo v emen ts in the n ull eld. Mo v emen t parameters are as in Fig. 15. 38
slide-14
SLIDE 14

−2 −1.8 −1.6 −1.4 −2.8 −2.6 −2.4 −2.2 −2 0.035 0.04 0.045 log10 ( rIM ) log10 ( rFM ) Mean Normalized Error −2 −1.8 −1.6 −1.4 −2.8 −2.6 −2.4 −2.2 −2 log10 ( rFM ) log10 ( rIM ) 0.03 0.035 0.04 0.045 0.05 0.055 −2 −1.8 −1.6 −1.4 −2.8 −2.6 −2.4 −2.2 −2 0.035 0.04 0.045 0.05 0.055 log10 ( rIM ) log10 ( rFM ) Mean Normalized Error −2 −1.8 −1.6 −1.4 −2.8 −2.6 −2.4 −2.2 −2 log10 ( rFM ) log10 ( rIM ) 0.03 0.035 0.04 0.045 0.05 0.055 0.06 0.065

Figure 18: Net normalized error in matc hing p erformance
  • f
the sim ulated adaptiv e con troller
  • f
Fig. 11 (switc h set to 1) with that
  • f
16 sub jects that practiced in eld B 2 after practice in B 1 as a function
  • f
adaptation rates in the forw ard and in v erse mo dels. The top gures are for sub jects that w ere exp
  • sed
to B 2 at 5 min after B 1 , the b
  • ttom
gures are for sub jects that w ere exp
  • sed
to B 2 at 6 hours after B 1 . The error w as estimated for com binations
  • f
v e dieren t rates
  • f
adaptation
  • f
the forw ard mo del (r F M = 0:008; 0:01; 0:015; 0:02 5; :04 ) and the in v erse mo del (r I M = 0:001; 0:003; 0:005; 0:0 08 ; 0:0 1). The p
  • sition
with minim um error v alue is at r im = 0:0025 and r f m = 0:0158 in the top ro w
  • f
gures, and r im = 0:004 and r f m = 0:025 for the b
  • ttom
ro w
  • f
gures. A t 6 hours, the learning rates are substan tially faster than at 5 min. 39