Fast Acquisition Techniques for Very long PN Codes for On-board - - PowerPoint PPT Presentation

fast acquisition techniques for very long pn codes for on
SMART_READER_LITE
LIVE PREVIEW

Fast Acquisition Techniques for Very long PN Codes for On-board - - PowerPoint PPT Presentation

Fast Acquisition Techniques for Very long PN Codes for On-board Secure TT&C Transponders G. Fittipaldi 1) , L. Simone 1) , I. Aguilar Sancez 2) 1) Thales Alenia Space (TAS-I), 2 ) European Space Agency (ESA) ToC Introduction ON-Board


slide-1
SLIDE 1

Fast Acquisition Techniques for Very long PN Codes for On-board Secure TT&C Transponders

  • G. Fittipaldi1), L. Simone1), I. Aguilar Sancez2)

1)Thales Alenia Space (TAS-I), 2) European Space Agency (ESA)

slide-2
SLIDE 2

ToC

  • Introduction
  • ON-Board PN Code Synchronizer Architecture Description

 Frequency Domain Correlation Technique  Very Large Doppler Compensation Technique  Anti-jamming Signal Processing  On-Board Codes Synchronization Processing

  • Simulation Results:

 Detection Probability and Code Acquisition Time for GSO-MEO and LEO Satellite Applications

  • Conclusions
slide-3
SLIDE 3

Introduction

Today Satellite Secure Telemetry Tracking and Command (TT&C) Link can be affected by High Power Intentional Jammer Attack (J/S=30dB) or Cryptographic Attack jointly with Low signal to Noise Ratio (SNR≥-25dB) and Large Frequency Doppler (FD=60KHz). To cope with Jamming and Cryptographic attack, a very Long Cryptographic PN Codes are suggested for Spread Spectrum TT&C Communications for both GSO, MEO and LEO Satellite Mission Scenarios Very Long PN Codes On-board Synchronization, in presence of High jamming Power Interference, CDMA Users, Low SNR and large Frequency Doppler

  • Needs:
  • Challenge:
  • Proposed Solution:

A new On-board Blind Synchronizer Architecture for GSO-MEO and LEO Scenarios based on Fast Acquisition Techniques for Very Long PN Codes

  • Scenario:
slide-4
SLIDE 4

Frequency Domain Correlation Technique Overview

             

 

* 1

* r x FFT r x FFT IFFT m r x r x m R

Local UP Local N r UP

    

 

         

   

1 * 

 

L Local ZP UP

r x FFT r x FFT IFFT m R Fast Acquisition of a very long PN Code in Low Signal to Noise ratio with high doppler and doppler rate and high jammer over signal power ratio (J/S) The correlation between the Up-link PN code and the Local one is performed in frequency domain exploiting the following relationship:

True only for N-Periodic signal

The Long Up-link PN Code is a non-periodic signal (N<<Up Link code length) Zero Padding Method

Only the first L+1 samples of the IFFT are preserved (IFFT)L+1 , discarding the others N Local-samples

 

r xLocal

 

r x

L Up/

L zeros (N-L) Up/L samples

N

slide-5
SLIDE 5

On-Board Synchronizer Architecture

FS ADC FFT* Local PN Code Gen Digital Front-End

W

+ + Parallel Searching Capability: L +1 Code Phases

Quadrature Up-Link Signal block FIF Q N-L L I N-L L I+j*Q Doppler Compensation D IFFT Block Resize (L+1) Jammer Mitigation Algorithm Threshold Test (TT) In-Phase Up-Link Signal block N FFT Code Tracking J/S<0 J/S>0 >TT <TT RC_ACQ On Board Local Code Block

On Board Code Shift = (L +1) Code Phases

A B C

ASIC ASIC/FPGA N = Incoming and Local Block Size (samples) L= Zero Padding Length (samples) D=Doppler Compensation Sub-ranges W=Non-Coherent Integration length RC_ACQ= Local Code Rate during Acquisition FS=Sampling Frequency=4RC RC=Code rate FIF=Intermediate Frequency FS=Sampling Frequency

FS/2

N =8192 samples=4071 chips L ~ 6500÷7000 samples=3250÷3500 chips

slide-6
SLIDE 6

Doppler Compensation Technique

    N

id N j L Up

d k X e i x   

  2 /

   

d t f i j L Up

f f X e t x

d

  

     2 /

Discrete Time Domain: Fourier Transform – Frequency Shifting Property

 :

/

i x

L Up

Input Sequence of length “N”

Any carrier frequency Doppler effect can be compensated by means of the circular rotation

  • f the FFT result according to the frequency compensation resolution, given by:

N f f

s

 

(fs is the sampling frequency, N is the length of the input sequence) The Loss due to the uncompensated carrier Doppler Frequency shift fd is determined by:

 

CI dop dop

T f c L    

2

sin

(TCI is the pre-detection integration time)

:

N

m

m module N operation

FFT* Doppler Compensation IFFT FFT Up-Link Code Local Code

To compensate the effect of the Up Link Carrier Frequency Doppler shift, the FFT*

  • utput circular shifting by a suitable amount of samples can be exploited:
slide-7
SLIDE 7

samples n DS 

F2=n*FFTRES

  • F2=-n*FFTRES

Doppler Subrange

DS=0 DS=1 DS=-1

subrange f _

f

DS=(D-1)/2 FDS=DS*n*FFTRES FDS=-DS*n*FFTRES DS=-(D-1)/2

Overlap

 

 

    N

n DS i N j L Up

n DS k X e i x    

   2 /

The Whole Up Link Carrier Frequency Doppler range ( ) is partitioned into “D” partially

  • verlapped Doppler Subranges (DS) which are tested serially over time by means of different

FFT* output circular shifting:

Doppler Compensation Technique

Freqeuncy Doppler

   

) ( , 2 1 ... 1 , , 1 ,.. 2 1

  • dder

D D D DS     

In order to compensate the DSth Doppler Subrange, the FFT* is circularly shifted by: is the minimum FFT samples shifting, designed based on the maximum Doppler allowed by synchronization algorithm without Doppler Compensation

n

f

slide-8
SLIDE 8

Jammer Mitigation Algorithm

The aim of the Jammer Mitigation Algorithm is to aid the useful correlation peak detection in a very hostile environment (jammer with large J/S).

The Output of the “Non Coherent Integrator ” is circularly shifted and then subtracted from its original version as show below:

1 2 L+1 L

  • 1

L L+1 L-1

  • 2-1

L+1-L L-L+1 1-L+1

  • =

Non coherent accumulator Output Circularly shifted Non coherent accumulator Output Jammer Mitigation Block Output

W

Jammer Mitigation Algorithm Threshold Test (TT) Code Tracking J/S<0 J/S>0 >TT <TT IFFTL Out On Board Code Shift (L+1)samples

Jammer Mitigation Algorithm

1000 2000 3000 4000 5000 6000 7000

  • 5
  • 4
  • 3
  • 2
  • 1

1 2 3 4 x 10

4

Correlation Samples Correlation Magnitude NCI Output

1000 2000 3000 4000 5000 6000 7000

  • 1.5
  • 1
  • 0.5

0.5 1 1.5 2 2.5 3 3.5 x 10

4

Correlation Samples Jammer Mitigation Algorithm Output - Input J/S=38dB Correlation Magnitude

slide-9
SLIDE 9

FS ADC FFT* Local PN Code Gen Digital Front-End

W

+ + Parallel Searching Capability: L +1 Code Phases

Quadrature Up-Link Signal block FIF Q N-L L I N-L L I+j*Q Doppler Compensation IFFT Block Resize (L+1) Jammer Mitigation Threshold Test (TT) In-Phase Up-Link Signal block N FFT Code Tracking J/S<0 J/S>0 >TT <TT RC_ACQ On Board Local Code Block

On Board Code Shift = (L +1) Code Phases

A B C

FS/2

  • Correlation peak expected value:

 

2 2

L N   

 ,

2 L N F f

s Max

Doppler

  

  • Maximum allowed Carrier Frequency Doppler

without compensation:

  • Parallel Searching Capability:

] [samples L

  • Incoming and Local Block Size “N” (samples) = FFT Length
  • Zero Padding Length “L” (samples)
  • Non Coherent Integration Length “W”

Algorithm Main Key Parameters:

  • Maximum Non coherent Integration length “W” to keep down

to ¼ chip the codes sliding and avoid to compensate the code doppler effect:

 

              

C Carrier S

R f L N F F W W 4 2

*

On Board Synchronizer Architecture Mathematical Overview

Shift Doppler Freq Link f . max  

slide-10
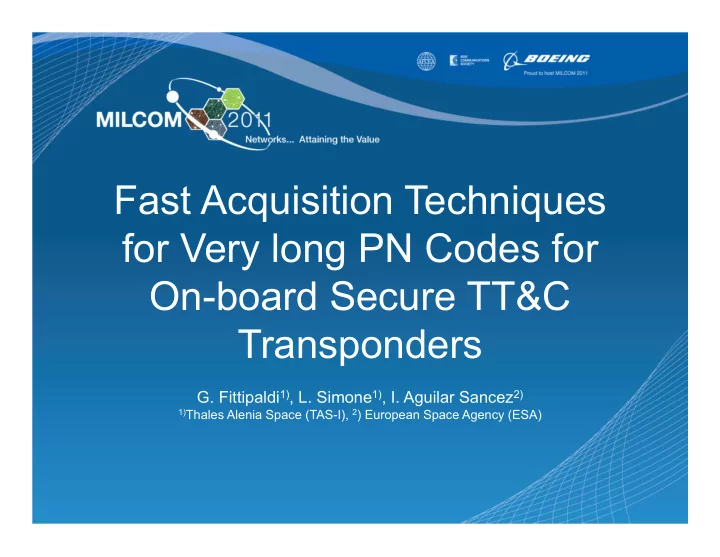
SLIDE 10

Synchronizer Architecture- Correlation Peak Detection example

FIF FS ADC FFT* Local PN Code Gen Digital Front-End

W

+ +

Quadrature Up-Link Signal block Q N-L L I N-L L I+j*Q Doppler Compensation D IFFT Block Resize (L+1) Jammer Mitigation Threshold Test (TT) In-Phase Up-Link Signal block N FFT Code Tracking J/S<0 J/S>0 >TT <TT RC_ACQ On Board Local Code Block

On Board Code Shift = (L +1) Code Phases

A B C

FS/2

N=8192 [samples], 4096 [chips], ( Sample block size) L=6890 [samples], 3445 [chips], (Zero Padding length) W=30, (non coherent Integration length) RC=4Mcps,(Code Rate) FIF=130MHz, (Receiver Intermediate Frequency) Fs=40MHz (Sampling Frequency) Code offset simulated=1999 samples=999.5 chips Correlation peak index=1999 (Simulation Result)

1000 2000 3000 4000 5000 6000 7000

  • 40
  • 20

20 40 60 80 100 120 140 Correlation-Peak Samples Correlation Peak

Up Link Carrier Doppler= +471KHz, S/N0=45dBHz ( SNR=-24dB) Codes misalignment=2000 samples

slide-11
SLIDE 11

Satellite Missions Requirements and On-Board Synchronizer Architecture Tuning

Mission Scenario Intermediate Freqeuncy FIF [MHz] Sampling Freqeuncy FS [MHz] Code Rate Rc [MCps] N [samples] L [samples] W (Nominal Mode) W (Stress Mode) Doppler sub ranges (Nominal Mode) Doppler sub-ranges (Stress Mode) GSO 130 40 10 8192 6000 25 30 1 1 MEO 135 12 3 8192 6200 4 20 5 5 LEO 135 12 3 8192 7300 5 5 7 25

Mission Scenario Up Link Carrier Frequency [MHz] Code Rate [MCps] SNR [dB] J/S [dB] Carrier Doppler Range [±Hz] Carrier Doppler Rate [±Hz/s] Data Rate [bps] GSO 40000 10

  • 27

30 1800 5 10000 MEO 2034,747 3

  • 9,78

27 8000 10 2000 LEO 2254,1 3 11,22 27 57000 700 2000

FIF FS ADC FFT* Local PN Code Gen Digital Front-End

W

+ +

Quadrature Up-Link Signal block Q N-L L I N-L L I+j*Q Doppler Compensation D IFFT Block Resize (L+1) Jammer Mitigation Threshold Test (TT) In-Phase Up-Link Signal block N FFT Code Tracking J/S<0 J/S>0 >TT <TT RC_ACQ On Board Local Code Block

On Board Code Shift = (L +1) Code Phases

A B C

FS/2

  • On Board Synchronization Processing Tuning for GSO-MEO-LEO Mission Scenarios
  • GSO-MEO and LEO Satellite

Missions RF Requirements

slide-12
SLIDE 12

Synchronization Performance Simulation Results-GSO Mission

GSO Mission – Detection Probability (Pd) and code Acquisition Time Vs input S/No, Up-Link Carrier Frequency Doppler Fd=2KHz. Pd = 100% for S/N0 ≥44dBHz (SNR=-29dB), Data Modulation degradation =1.5dB Average Code Acquisition Time ( Code Length Lcode=226 chips) lower than 31s Average Code Acquisition Time ( Code Length Lcode=224 chips) lower than 9s

42 43 44 45 46 47 48 0.2 0.3 0.4 0.5 0.6 0.7 0.8 0.9 1 S/No [dBHz] Simulated Detection Probability Pd Simulated Code Acquisition Probability vs input S/No Data Modulation Rb=10Kbps No data Modulation 42 43 44 45 46 47 48 10 20 30 40 50 60 70 80 90 100 110 120 130 140 Average Code Acquisition Time vs C/No,Data Rb=10Kbps C/No[dBHz] Average Simulated Acquisition Time [s] Code Length=220 Code Length=222 Code Length=224 Code Length=226

slide-13
SLIDE 13

GSO Mission – Detection Probability and Code Acquisition Time Vs input J/S, Up-Link Carrier Frequency Doppler Fd=2KHz. Pd = 100% for J/S ≤ 31dB , Data Modulation Degradation=0.5dB Average Code Acquisition Time ( Code Length Lcode=226 chips) lower than 38s Average Code Acquisition Time ( Code Length Lcode=224 chips) lower than 10s

Synchronization Performance Simulation Results-GSO Mission

25 26 27 28 29 30 31 32 33 34 35 36 37 38 39 40 0.65 0.7 0.75 0.8 0.85 0.9 0.95 1 J/S [dB] Detection Probability Pd Simulated Code Acquisition Probability v s input J/S No Data Modulation Data Modulation Rb=10Kbps 25 26 27 28 29 30 31 32 33 34 35 36 37 38 39 40 5 10 15 20 25 30 35 40 45 50 55 60 J/S [dB] Maximum Simulated Acquisition Time [s] Maximum Acquisition Time v s J/S,Data Rb=10Kbps Code Length=220 Code Length=222 Code Length=224 Code Length=226

slide-14
SLIDE 14

MEO Mission – Detection Probability and Code Acquisition Time Vs input S/No, Up-Link Carrier Frequency doppler Fd=8KHz Pd = 100% for S/N0 ≥52dBHz, Data Modulation degradation lower than 1dB Average Code Acquisition Time ( Code Length Lcode=226 chips) lower than 72s Average Code Acquisition Time ( Code Length Lcode=224 chips) lower than 18s Average Code Acquisition Time ( Code Length Lcode=222 chips) lower than 4.49s

Synchronization Performance Simulation Results-MEO Mission

48 49 50 51 52 53 54 55 56 57 58 59 60 0.75 0.8 0.85 0.9 0.95 1 S/No [dBHz] Simulated Detection Probability Pd Simulated Detection Probability vs S/No Data Modulation Rb=Kbps No data Modulation 48 49 50 51 52 53 54 55 56 57 58 59 60 10 20 30 40 50 60 70 80 90 100 S/N

  • [dBH

z] Simulated Acquisition Time [s] Av erage Acquisition T im e v s S/N

  • ,D

ata R b=2Kbps C

  • de Length=2

20

C

  • de Length=2

22

C

  • de Length=2

24

C

  • de Length=2

26

slide-15
SLIDE 15

MEO Mission – Detection Probability and Code Acquisition Time vs input J/S, Up-Link Carrier Frequency Doppler Fd=8KHz Pd = 99% for J/S ≤29dB, Data Modulation Degradation=0.5-1dB Average Code Acquisition Time ( Code Length Lcode=224 chips) lower than 51s Average Code Acquisition Time ( Code Length Lcode=222 chips) lower than 18s Average Code Acquisition Time ( Code Length Lcode=220 chips) lower than 5s

Synchronization Performance Simulation Results-MEO Mission

24 25 26 27 28 29 30 31 32 33 34 35 36 0.2 0.3 0.4 0.5 0.6 0.7 0.8 0.9 1 J/S [dB] Detection Probability Pd Simulated Code Acquisition Probability v s input J/S Data Modulation Applied Rb=2Kbps No Data Modulation

24 26 28 30 32 34 36 20 40 60 80 100 120 140 160 180 200 220 240 250 J/S [dB] Average Simulated Acquisition Time [s] Average Acquisition Time vs J/S,Data Rb=2Kbps Code Length=220 Code Length=222 Code Length=224 Code Length=226

slide-16
SLIDE 16

LEO Mission – Detection Probability and Code Acquisition Time vs input S/No, Up-Link Carrier Frequency Doppler Fd=57KHz. Pd = 100% for S/N0 ≥61dBHz, Data Modulation degradation lower than 0.3dB Average Code Acquisition Time ( Code Length Lcode=226 chips) lower than 70s Average Code Acquisition Time ( Code Length Lcode=224 chips) lower than 18s Average Code Acquisition Time ( Code Length Lcode=222 chips) lower than 11s

Synchronization Performance Simulation Results-LEO Mission

55 57 59 61 63 65 67 69 71 73 75 77 7980 0.1 0.2 0.3 0.4 0.5 0.6 0.7 0.8 0.9 1 S/No [dBHz] Simulated Detection Probability Pd Simulated Detection Probability vs input S/No Data Modulatio Applied Rb=2Kbps No Data Modulation

55 57 59 61 63 65 67 69 71 73 75 77 79 80 10 20 30 40 50 60 70 80 90 Average Acquisition Time vs C/No,Data Rb=2Kbps S/No[dBHz] Average Simulated Acquisition Time [s] Code Length=220 Code Length=222 Code Length=224 Code Length=226

slide-17
SLIDE 17

LEO Mission – Detection Probability and Code Acquisition Time vs input S/No, Up Link Carrier Frequency Doppler Fd=57KHz. Pd = 99% for J/S ≤27dB, Data Modulation Degradation=1dB Average Code Acquisition Time ( Code Length Lcode=224 chips) lower than 18s Average Code Acquisition Time ( Code Length Lcode=222 chips) lower than 6s

Synchronization Performance Simulation Results-LEO Mission

24 25 26 27 28 29 30 31 32 33 34 35 36 37 38 15 30 45 60 75 90 105 120 135 150 J/S [dB] Average Simulated Acquisition Time [s] Average Acquisition Time vs J/S,Data Rb=2Kbps Code Length=220 Code Length=222 Code Length=224 Code Length=226 24 25 26 27 28 29 30 31 32 33 34 35 36 37 38 0.2 0.3 0.4 0.5 0.6 0.7 0.8 0.9 1 J/S [dB] Detection Probability Pd Simulated Code Acquisition Probability vs input J/S No Data Modulation Data Modulation Applied Rb=2Kbps

slide-18
SLIDE 18

Conclusions:

A Novel PN Codes On-Board Synchronization Processing has been presented and optimized for GSO, MEO and LEO Satellite for Telemetry Tracking and Command Secure Link Applications. A very Long PN Code (Code Length: 224-226 chips, 216 times longer than the ETSI Standard) can be synchronized Blindly in a few seconds in a very hostile environment characterized by large Doppler (up to 60KHz for LEO scenario) ad high Jammer over Signal Power Ratio (J/S=30dB). The proposed Synchronizer Architecture allows adopting a Secure TT&C Spread Spectrum link not only for GSO Mission but also for more challenging MEO and LEO missions. A Bread-Board Model prototyping of the Synchronizer Architecture is in progress at TAS-I Synchronizer Architecture design for LEOP Satellite phase.

On-going Activities: