FACILITIES MASTER PLANNING Regional Community Conversations: - - PowerPoint PPT Presentation

facilities master planning
SMART_READER_LITE
LIVE PREVIEW

FACILITIES MASTER PLANNING Regional Community Conversations: - - PowerPoint PPT Presentation

Atla lanta Public Schools FACILITIES MASTER PLANNING Regional Community Conversations: Guardrails, Current and Future Enrollment ry 15 th th , 2020 January 8 th th , Wednesday, Ja January Wednesday, Ja , 2020 6:0 :00 8:0 :00 PM 6:0


slide-1
SLIDE 1

Facilities Master Planning

1

Atla lanta Public Schools

FACILITIES MASTER PLANNING

Regional Community Conversations: Guardrails, Current and Future Enrollment

Tus uskegee Airm Airmen Glo lobal Ac Academy 20 2019 19 Construction

Th Thursday, , Jan January ry 16th

th, 2020

6:0 :00 – 8:0 :00 PM Th Therrell ll Hig igh Sc School Wednesday, Jan January ry 22nd

nd,

, 2020 6:0 :00 – 8:0 :00 PM Washin ington Hig igh Sc School

Wednesday, Ja January 8th

th,

, 2020 6:0 :00 – 8:0 :00 PM BEST/CS Kin ing Wednesday, Ja January ry 15th

th, 2020

6:0 :00 – 8:0 :00 PM In Inman Mid iddle Sch chool

slide-2
SLIDE 2

2

Facilities Master Planning

Objectives

Goals ls an and In Input fr from Se Session Se Set One Plan lanning Gu Guardrails ils Approach to

  • Enrollment

For

  • recast

1 2 3

slide-3
SLIDE 3

3

Facilities Master Planning

Agenda

Spri Springdale Par ark ES

  • In

Intr troduction Sc Scop

  • pe & Flo

Flow Prog

  • gress to
  • Date

Plan lanning Gu Guar ardrails Curr rrent Cap apac acity Enrollment For

  • recast

Qu Question an and Answer Ne Next xt St Steps

slide-4
SLIDE 4

4

Facilities Master Planning

Facilities Master Planning Team

Communications

HL STRATEGY

Eng Engag agement

SYCAMORE CONSULTING

Real eal Es Estate and and De Demographic Ana Analysi sis

BLEAKLY ADVISORY GROUP

Plan lanning

SIZEMORE GROUP

slide-5
SLIDE 5

5

Facilities Master Planning

Agenda

Spri Springdale Par ark ES

In Intr troduction

  • Scope & Fl

Flow

Prog

  • gress to
  • Date

Plan lanning Gu Guar ardrails Curr rrent Cap apac acity Enrollment For

  • recast

Con

  • nclusion

Ne Next xt St Steps

slide-6
SLIDE 6

6

Facilities Master Planning

Facilities Master Planning for APS

Strategic Clu luster School Capit ital Proje ject

Ho Howard Bldg.

slide-7
SLIDE 7

7

Facilities Master Planning

In Inventory and Assessment

Scope & Flow

  • FEEDBACK LOOP
  • COLLECT | SHARE| DECIDE
  • ENGAGEMENT
  • Board
  • Community
  • Key Sessions

Sch chool Opti tions Oth ther Property Recommendations In Inventory and Assessment

1 2 3

Im Implementation Guardrails, Current Conditions & Forecasting

slide-8
SLIDE 8

8

Facilities Master Planning

Agenda

Spri Springdale Par ark ES

In Intr troduction Sc Scop

  • pe & Flo

Flow

  • Prog
  • gress to
  • Date

Plan lanning Gu Guar ardrails Curr rrent Cap apac acity Enrollment For

  • recast

Qu Question an and Answer Ne Next xt St Steps

slide-9
SLIDE 9

9

Facilities Master Planning

Progress to Date

OBJ BJECT CTIV IVE: To review input on goals To review input from Community Conversation Set One Share discussions with external entities

slide-10
SLIDE 10

10

Facilities Master Planning

Facilities Master Plan Goals - Draft

The he pl plan annin ing for r this this pr project is is gu guid ided by y thes these go goals ls:

To

  • eq

equit itably cr create inn innovativ ive, sus sustain inable, fl flexib ible le, an and effic ficie ient t en envir ironments. To

  • eq

equit itably pr provid ide qua quali lity ty sc schools tha that t alig align facil ilit ity an and ac academic ic ob

  • bje

jectiv ives to

  • str

trengthen com

  • mmunitie

ies. To

  • eq

equit itably dis distri ribute ins nstructio ional l spa space am amon

  • ng fac

acili litie ies. To

  • eq

equit itably alig align pr prop

  • pert

rty use use, disp dispositio ion, and and ac acquisit ition with APS APS val alues and and prio priorit itie ies whi hile le exp xplo lorin ing alt alternativ ive opp

  • pport

rtunitie ies for

  • r the

the usa usage of

  • f facil

ilit itie ies.

Note: goals will be defined by the Atlanta Board of Education

slide-11
SLIDE 11

11

Facilities Master Planning

Feedback from Community Conversations

What will constitute ‘a successful master planning process’? What must this is process accompli lish?

For APS | For the City of Atlanta: Interagency dialogue (AH, IA, Planning) | Beyond

What is is th the most t im important outcome th this is process must provi vide for, , enable le,

  • r

r su support? What are your r Iss Issues or r Co Concerns?

Stay Updated wit ith Facili litie ies Master Pla lannin ing!

  • Submit Feedback & Questions

through Let’s Talk

  • Visit the FMP Website

https://www.atlantapublicschools.us/FMP

slide-12
SLIDE 12

12

Facilities Master Planning

Q1: What will constitute ‘a successful master planning process’?

Expanded Cabinet Key Words

  • Input
  • Process
  • Outcomes

Community Conversations Input

  • Reflective of Student Needs
  • Community driven
  • Collaborative
  • Leverages

Property/Resources

slide-13
SLIDE 13

13

Facilities Master Planning

Q2: What must this process accomplish?

Expanded Cabinet Key Words

  • Innovation
  • Updates
  • Upgrades
  • Equity
  • Input
  • Collaboration
  • Outcomes

Community Conversations Input

  • Equitable facilities
  • Sustainable facilities
  • Collaboration
  • Relationships
  • Community Input
slide-14
SLIDE 14

14

Facilities Master Planning

Q3: What is the most important outcome this process must provide for, enable, or support?

Expanded Cabinet Key Words

  • Equity
  • Facilities
  • Accommodations
  • Infrastructure
  • Input
  • Process
  • Shared Use
  • Collaboration
  • Vision
  • Long Term Planning

Community Conversations Input

  • Facilities Aligned w/School

Goals

  • Clear Direction
  • Addresses Current Needs
  • Long-Term Planning
  • Clear Vision
slide-15
SLIDE 15

15

Facilities Master Planning

Q4: What are your Issues or Concerns?

Expanded Cabinet Key Words

  • Equity
  • Infrastructure
  • Facilities
  • Input
  • Outcomes
  • Facility-Specific
  • Cluster-Specific

Community Conversations Input

  • Lack of Community Input
  • Data is Balanced w/Reality
  • Sustainability
  • Rezoning
  • Annexations
  • Intergovernmental

Relationships

  • Social Issues are Addressed
slide-16
SLIDE 16

16

Facilities Master Planning

Other External Entities

  • Atlanta Housing
  • Invest Atlanta
  • Atlanta Regional Commission
  • City of Atlanta Planning
  • City of Atlanta Housing
  • Enterprise Community Partners
  • Georgia Tech
slide-17
SLIDE 17

17

Facilities Master Planning

Agenda

Spri Springdale Par ark ES

In Intr troduction & Ob Obje jectives Sc Scop

  • pe & Flo

Flow Prog

  • gress to
  • Date
  • Plannin

ing Gua uardrail ils

Curr rrent Cap apac acity Enrollment For

  • recast

Qu Question an and Answer Ne Next xt St Steps

slide-18
SLIDE 18

18

Facilities Master Planning

OBJ BJECT CTIV IVE: Present Key Guidelines, Working Premises, & Policies Review Methodology

Planning Guardrails (Guidelines, Working Premises & Policies)

slide-19
SLIDE 19

19

Facilities Master Planning

Planning Guidelines

1.

  • 1. Cl

Class s Si Size

For facilities, the planning team will calculate APS capacity using the AVERAGES below:

  • Primary (K-3) – 21 students/classroom
  • Elementary (4-5) – 23 students/classroom
  • Middle (6-8) – 24 students/classroom
  • High (9-12) - 25 students/classroom

Note: In 2017 APS switched from planning capacity in all grade levels @25 to the capacities defined in the Student Suc uccess Fo Formula.

2.

  • 2. Ex

Exis isti ting Br Brea eakdown of

  • f Gr

Grades

APS will continue current grade arrangements:

  • Elementary School Pre-K, K-5
  • Middle School 6-8
  • High School 9-12

Existing schools with different grade level arrangements will remain as currently arranged. Additional grade level configurations will be considered as proposed by the administration.

3.

  • 3. Maximum & Min

inimum Sc School l Si Size

Target ranges for the size of ne new schools are established as:

  • Elementary School

450 – 600 Students

  • Middle School

750 - 900 Students

  • High School

1200 - 2000 Students These planning guidelines do not contemplate closing or splitting schools solely because they are smaller or larger than the designated range.

4.

  • 4. Sit

Site Si Size

The following APS mi mini nimum ne new site targets, which include provision of recreation fields and parking, have been established:

  • Elementary School

(5 Acres)

  • Middle School

(10 Acres)

  • High School

(25 Acres)

slide-20
SLIDE 20

20

Facilities Master Planning

Methodology - Equitable School

Ho How w Sch Schoo

  • ol

l Cap Capacit ity is Calc Calcula lated:

The total number of Instructional Units remaining after excluding the non-core classrooms, Equity Allocation (Psychological and Social support), and Gifted Programs multiplied by the number of students per classroom. The number of students per classroom is determined using the Funding Level numbers used for each respective grade level. This result is then compared to the Current Year Enrollment (FTE-1) to determine whether a school is Over Capacity, Approaching Capacity, or Under Capacity Note: Capacity for Charter Schools is set by the specific charter agreement with APS Non-Core Classrooms Equity Allocation

(SSF Formula)

Gifted Programs

(SSF Formula)

# Core Classrooms

X

# of Students per Classroom (SSF)

=

School Capacity

Total Instructional Spaces

Current Year Enrollment (FTE-1)

Vs.

Note: # Core Classrooms assumes spaces are used as originally intended/designed

slide-21
SLIDE 21

21

Facilities Master Planning

Methodology – Site

Ho How w Sit Site Cap Capacit ity is Calc Calcula lated:

The total acreage guideline is calculated by adding physical education/play space, parking, and building footprint with a net/gross factor of 50% to accommodate circulation between each space. This result is then compared to the Existing Site Acreage to determine whether a school site is under- sized. Note: Site Capacity for Charter Schools is set by the specific charter agreement with APS Net/Gross Factor

  • f 50%

Building Footprint Parking Physical Education/ Play Space

=

Site Existing Acreage

Vs.

slide-22
SLIDE 22

22

Facilities Master Planning

Working Premises

Sch Schoo

  • ol

l Cap Capacit ity Plannin ing

The facilities will be organized around Elementary School attendance zones. Middle schools will be arranged by the sum of specific Elementary school attendance zones. High schools will be arranged based on the sum of specific Middle school attendance zones. Rezoning cluster boundaries is not outside of the realm of

  • possibility. However, it has not been identified as a priority for the Facilities Master

Plan. The Policy of “Administrative Transfers” will remain, but the facilities will be planned

  • n the Demographic count of students within the attendance zone. Administrative

transfers will be limited to current or planned permanent space.

Su Surp rplu lus Prop

  • perty

School sites will be identified for future sale if they are well below site standards, are within close distance of an existing school (½ mile for elementary schools) and/or not supported by the population trends for the year 2040. Sites may be exempted if large enough to house a future Elementary School site, or if designated for a specific school support use. All sites identified for future sale will be appraised and recommended to the Board for their consideration before site specific solicitation of community and private developers.

Co Communit ity Uses or

  • r Fun

Functio ions to

  • be

be Co Cons nsid idered in n the the Sch Schoo

  • ols

ls

Community uses will be defined on a site by site basis. Strategic alliances are sought to provide facilities for programs such as:

  • Parks and Recreation Sites
  • Libraries
  • Pre-K
  • Other programs as identified by the community

Tran anspor

  • rtatio

ion

Atlanta Public Schools is studying strategies for how to address the location and transportation requirements of Special Needs Students.

slide-23
SLIDE 23

23

Facilities Master Planning

APS Policies & GA Law

AP APS S Polic

  • licie

ies

Residents interested in attending an APS school, but liv live ou

  • utside of
  • f the

ci city of

  • f Atla

lanta, may attend if space is available, and pay non-resident

  • tuition. APS offers two types of School Choice transfers:

General Administrative Transfers – permits students to attend an

  • ut-of-zone school un

until the he hig highest gr grade of

  • f sch

school (as allowable by Cohort aging). Georgia Special Needs Scholarship Transfers – permits eligible special education students to request a transfer to another APS school on the basis of special needs.

(Source: APS Website: Student Transfer Options https://www.atlantapublicschools.us/transfers) JBCCA-R(2) – Admin inis istr trativ ive Tran ansfers

Schools at 90% or above of the facility’s planning capacity based upon the anticipated future enrollment are ineligible to accept school choice transfers for the following school year. If enrollment growth projections show that a school will reach or exceed 90% capacity within any school year in which a transfer is valid, that school is ineligible to accept school choice transfers. Schools below 90% of the facility’s planning capacity may be ineligible to accept transfers based on the number of teachers allocated to the school and the state class size maximums.

Adm Admin inis istrativ ive Tran ansfers

Georgia Law Georgia’s Public School Choice Law (Intradistrict Transfer), allows city of Atlanta residents the option to apply to attend a public school outside

  • f their zoned school area, if space is available. (O.C.G.A. § 20-2-2131

also known as House Bill 251).

slide-24
SLIDE 24

24

Facilities Master Planning

Agenda

Spri Springdale Par ark ES

In Intr troduction Sc Scop

  • pe & Flo

Flow Prog

  • gress to
  • Date

Plan lanning Gu Guar ardrails

  • Curr

urrent t Cap apacity ty

Enrollment For

  • recast

Con

  • nclusion

Ne Next xt St Steps

slide-25
SLIDE 25

25

Facilities Master Planning

Current Capacity

OBJ BJECT CTIV IVE: Illustrate application of the Planning Guardrails on current school’s enrollment

slide-26
SLIDE 26

26

Facilities Master Planning

EQUITY BASELINE FLEXIBILITY

Recurring Themes

slide-27
SLIDE 27

27

Facilities Master Planning

Current Capacity Model Methodology

Note: # Core Classrooms assumes spaces are used as originally intended/designed Non-Core Classrooms Equity Allocation

(SSF Formula)

Gifted Programs

(SSF Formula)

# Core Classrooms

X

# of Students per Classroom (SSF)

=

School Capacity

Total Instructional Spaces

Current Year Enrollment (FTE-1)

Vs.

slide-28
SLIDE 28

28

Facilities Master Planning

DRAFT -Capacity vs. Enrollment – Elementary (K-5)

Note: 2019-2020 Enrollment provided by APS Demographics

  • Department. Enrollment reflects adjustments made to reflect

students enrolled in alternative programs. Hence title – Modified FTE-1. 2019-2020 Total Students Living in Zone Not Attending Zoned School is equal to the total number of administrative transfers, Charter School Students, and Private School Students. All Information provided by APS Demographics.

COLOR INDEX

Enrollment > 90% of Capacity Enrollment Between 75%-90% Enrollment between 65%-75% Enrollment between 55%-65% Enrollment between 45%-55%

School Capacity

2019-2020 Enrollment (Modified FTE-1) % FILL (ENROLLMENT/CAPACITY) 2019-2020 Total Students Living in Zone Not Attending Zoned School Finch

758

360

48% 149

Gideons

693

328

47% 128

Perkerson

541

364

67% 182

SlaterES

780

505

65% 263

Thomasville

780

329

42% 84

Cluster Carver School Name

BASE CLASSROOM CAPACITY

Boyd

495

442

89% 193

FL Stanton

299

224

75% 121

Harper Archer

998

638

64% 138

Scott

542

361

67% 131

Usher-Collier

747

400

54% 182

Woodson Park

780

617

79% 166

Douglass Hope-Hill

497

336

68% 347

Mary Lin

693

708

102% 96

Morningside

737

946

128% 225

Springdale Park

693

782

113% 167

Grady

slide-29
SLIDE 29

29

Facilities Master Planning

Note: 2019-2020 Enrollment provided by APS Demographics

  • Department. Enrollment reflects adjustments made to reflect

students enrolled in alternative programs. Hence title – Modified FTE-1. 2019-2020 Total Students Living in Zone Not Attending Zoned School is equal to the total number of administrative transfers, Charter School Students, and Private School Students. All Information provided by APS Demographics.

COLOR INDEX

Enrollment > 90% of Capacity Enrollment Between 75%-90% Enrollment between 65%-75% Enrollment between 55%-65% Enrollment between 45%-55%

School Capacity

2019-2020 Enrollment (Modified FTE-1) % FILL (ENROLLMENT/CAPACITY) 2019-2020 Total Students Living in Zone Not Attending Zoned School Benteen

579

247

43% 70

Burgess-Peterson

766

483

63% 142

Dunbar

412

344

84% 175

Obama

612

281

46% 83

Parkside

614

527

86% 583

Toomer

502

442

88% 748

Jackson Cluster School Name

BASE CLASSROOM CAPACITY

Bolton

729

529

73% 166

Brandon-ES

670

448

67% 287

Brandon-Primary

520

505

97% 285

Garden Hills

671

460

69% 276

Jackson Primary

328

214

65% 309

Jackson Elem

673

439

65% 307

Rivers

990

743

75% 281

Smith Intermediate

578

464

80% 196

Smith ES

501

436

87% 195

North Atlanta Beecher Hills

350

286

82% 101

Cascade

420

401

96% 73

Miles

695

533

77% 262

West Manor

180

277

154% 72

Peyton Forest

419

425

101% 136

Mays

DRAFT -Capacity vs. Enrollment – Elementary (K-5)

slide-30
SLIDE 30

30

Facilities Master Planning

Note: 2019-2020 Enrollment provided by APS Demographics

  • Department. Enrollment reflects adjustments made to reflect

students enrolled in alternative programs. Hence title – Modified FTE-1. 2019-2020 Total Students Living in Zone Not Attending Zoned School is equal to the total number of administrative transfers, Charter School Students, and Private School Students. All Information provided by APS Demographics.

COLOR INDEX

Enrollment > 90% of Capacity Enrollment Between 75%-90% Enrollment between 65%-75% Enrollment between 55%-65% Enrollment between 45%-55%

School Capacity

2019-2020 Enrollment (Modified FTE-1) % FILL (ENROLLMENT/CAPACITY) 2019-2020 Total Students Living in Zone Not Attending Zoned School Cleveland

554

305

55% 74

Dobbs

788

434

55% 196

Heritage Academy

678

428

63% 152

Humphries

427

251

59% 93

Hutchinson

568

401

71% 112

South Atlanta Cluster School Name

BASE CLASSROOM CAPACITY

MA Jones

764

488

64% 224

Tuskegee

798

566

71% 262

Washington Cleveland

554

305

55% 74

Dobbs

788

434

55% 196

Heritage Academy

678

428

63% 152

Humphries

427

251

59% 93

Hutchinson

568

401

71% 112

South Atlanta

DRAFT -Capacity vs. Enrollment – Elementary (K-5)

slide-31
SLIDE 31

31

Facilities Master Planning

DRAFT - Capacity vs. Enrollment – Middle (6-8)

Note: 2019-2020 Enrollment provided by APS Demographics

  • Department. Enrollment reflects adjustments made to reflect

students enrolled in alternative programs. Hence title – Modified FTE-1. 2019-2020 Total Students Living in Zone Not Attending Zoned School is equal to the total number of administrative transfers, Charter School Students, and Private School Students. All Information provided by APS Demographics.

COLOR INDEX

Enrollment > 90% of Capacity Enrollment Between 75%-90% Enrollment between 65%-75% Enrollment between 55%-65% Enrollment between 45%-55%

School Capacity

2019-2020 Enrollment (Modified FTE-1) % FILL (ENROLLMENT/ CAPACITY) 2019-2020 Total Students Living in Zone Not Attending Zoned School Carver Price

960

387

40% 125

Sutton (Northside)

1,499

1,073

72% 889

Sutton (Powers Ferry)

995

578

58% 895

Carver Sylvan Hills

922

530

58% 160

Mays Young

1,099

818

74% 282

Cluster

  • N. Atlanta

School Name

BASE CLASSROOM CAPACITY School Capacity

2019-2020 Enrollment (Modified FTE-1) % FILL (ENROLLMENT/ CAPACITY) 2019-2020 Total Students Living in Zone Not Attending Zoned School Washington Brown

1,194

406

34% 232

Therrell Bunche

934

982

105% 258

Grady Inman

576

1,120

194% 427

Jackson King

904

844

93% 831

Douglass Lewis Academy

1,786

950

53% 386

  • S. Atlanta

Long

1,031

780

76% 245

Cluster School Name

BASE CLASSROOM CAPACITY

slide-32
SLIDE 32

32

Facilities Master Planning

DRAFT - Capacity vs. Enrollment – High (9-12)

Note: 2019-2020 Enrollment provided by APS Demographics

  • Department. Enrollment reflects adjustments made to reflect

students enrolled in alternative programs. Hence title – Modified FTE-1. 2019-2020 Total Students Living in Zone Not Attending Zoned School is equal to the total number of administrative transfers, Charter School Students, and Private School Students. All Information provided by APS Demographics.

COLOR INDEX

Enrollment > 90% of Capacity Enrollment Between 75%-90% Enrollment between 65%-75% Enrollment between 55%-65% Enrollment between 45%-55% School Capacity

2019-2020 Enrollment (Modified FTE-1) % FILL (ENROLLMENT/C APACITY) 2019-2020 Total Students Living in Zone Not Attending Zoned School Carver Carver

1,550

904

58% 316

Douglass Douglass

2,064

1,020

49% 451

Grady Grady

1,275

1,468

115% 522

Maynard Jackson Jackson

1,413

1,340

95% 399

Mays Mays

1,875

1,228

65% 319

Cluster School Name

BASE CLASSROOM CAPACITY

School Capacity

2019-2020 Enrollment (Modified FTE-1) % FILL (ENROLLMENT/C APACITY) 2019-2020 Total Students Living in Zone Not Attending Zoned School North Atlanta North Atlanta

2,650

2,131

80% 2129

South Atlanta South Atlanta

1,618

806

50% 251

Therrell Therrell

1,373

850

62% 336

Washington Washington

1,633

731

45% 271

Cluster School Name

BASE CLASSROOM CAPACITY

slide-33
SLIDE 33

33

Facilities Master Planning

Current Capacity Model – Site Methodology

Net/Gross Factor

  • f 50%

Building Footprint Parking Physical Education/ Play Space

=

Site Capacity Existing Acreage

Vs.

slide-34
SLIDE 34

34

Facilities Master Planning

DRAFT – Site Capacity – Elementary (K-5)

COLOR INDEX

Total Guideline Acreage greater than the Existing Acreage Total Guideline Acreage Less than Existing Acreage Total Guideline Acreage

Existing Acreage Finch

5.29

3.8 Gideons

5.10

4.5 Perkerson

5.73

9 SlaterES

4.77

13 Thomasville

4.86

11.15 School Name

SITE

Cluster Carver Boyd

4.61

19.7 FL Stanton

3.81

5.2 Harper Archer

8.25

18.1 Scott

4.62

8 Usher-Collier

5.63

14 Woodson Park

4.97

7 Douglass Hope-Hill

4.34

2.4 Mary Lin

5.16

2.3 Morningside

4.91

5.2 Springdale Park

3.94

5.5 Grady Beecher Hills

4.15

9.5 Cascade

5.41

10 Miles

6.17

15 West Manor

3.71

10.8 Peyton Forest

5.14

25 Mays

Total Guideline Acreage

Existing Acreage Benteen

5.51

4 Burgess-Peterson

5.40

8.3 Dunbar

4.48

5.3 Obama

4.28

6 Parkside

6.04

8.3 Toomer

4.64

10.6 School Name

SITE

Cluster Jackson Bolton

4.78

4 Brandon-ES

4.20

10 Brandon-Primary

4.57

8.6 Garden Hills

4.67

8 Jackson Primary

3.54

7.5 Jackson Elem

4.89

12.5 Rivers

4.94

8 Smith Intermediate

4.67

6.2 Smith ES

5.02

10.3 North Atlanta

Total Guideline Acreage

Existing Acreage Continental Colony

5.11

8.7 Deerwood Academy

6.52

21 Fickett

4.64

12 Kimberly

4.85

7.2 School Name

SITE

Cluster Therrell MA Jones

5.10

7.5 Tuskegee

4.84

3.7 Washington Cleveland

5.74

9.6 Dobbs

6.43

19.6 Heritage Academy

6.09

7 Humphries

4.15

8.2 Hutchinson

5.32

8.5 South Atlanta

slide-35
SLIDE 35

35

Facilities Master Planning

Total Guideline Acreage

Existing Acreage Washington Brown

11.31

15.60 Therrell Bunche

11.10

42.30 Grady Inman

10.79

4.20 Jackson King

11.79

9.59

SITE

Cluster School Name

DRAFT – Site Capacity – Middle (6-8)

COLOR INDEX

Total Guideline Acreage greater than the Existing Acreage Total Guideline Acreage Less than Existing Acreage

Total Guideline Acreage

Existing Acreage Douglass Lewis Academy

12.94

17.00

  • S. Atlanta

Long

10.37

15.60 Carver Price

10.13

19.00 Sutton (Northside)

13.60

17.50 Sutton (Powers Ferry)

10.18

12.50 Carver Sylvan Hills

11.00

13.00 Mays Young

11.03

15.00

SITE

Cluster

  • N. Atlanta

School Name

slide-36
SLIDE 36

36

Facilities Master Planning

DRAFT – Site Capacity – High (9-12)

COLOR INDEX

Total Guideline Acreage greater than the Existing Acreage Total Guideline Acreage Less than Existing Acreage

Total Guideline Acreage

Existing Acreage Carver

26.47

35.4 Douglass

26.30

32 Grady

29.73

19.5 Jackson

23.90

25 Mays

30.02

70.4

SITE

School Name

Total Guideline Acreage

Existing Acreage North Atlanta

34.01

56.6 South Atlanta

24.48

50.2 Therrell

24.54

17.3 Washington

23.45

21.1

SITE

School Name

slide-37
SLIDE 37

37

Facilities Master Planning

Capacity vs. Enrollment and Site– Alternative Grade Configuration Schools

COLOR INDEX - SITE

Total Guideline Acreage greater than the Existing Acreage Total Guideline Acreage Less than Existing Acreage Note: 2019-2020 Enrollment provided by APS Demographics

  • Department. Enrollment reflects adjustments made to reflect

students enrolled in alternative programs. Hence title – Modified FTE-1. 2019-2020 Total Students Living in Zone Not Attending Zoned School is equal to the total number of administrative transfers, Charter School Students, and Private School Students. All Information provided by APS Demographics. Centennial Place Academy is a Conversion Charter. Capacity is being tracked and calculated due to its impact on the Cluster

COLOR INDEX

Enrollment > 90% of Capacity Enrollment Between 75%-90% Enrollment between 65%-75% Enrollment between 55%-65% Enrollment between 45%-55%

Total Guideline Acreage

Existing Acreage Citywide BEST /C.S. King (6-12)

17

21.2 Grady Centennial Place (K-8)

6

5 Washington Hollis (K-8)

12.30

5

SITE

Cluster School Name

School Capacity

2019-2020 Enrollment (Modified FTE-1) % FILL (ENROLLMENT /CAPACITY) 2019-2020 Total Students Living in Zone Not Attending Zoned School Citywide BEST /C.S. King (6-12)

1,769

624

35%

* Grady Centennial Place (K-8)

606

799

132% 140

Washington Hollis (K-8)

1,125

714

63% 233

Cluster School Name

BASE CLASSROOM CAPACITY

slide-38
SLIDE 38

38

Facilities Master Planning

Work in Progress Example – Howard MS

Note: 2019-2020 Enrollment provided by APS Demographics

  • Department. Enrollment reflects adjustments made to reflect

students enrolled in alternative programs. Hence title – Modified FTE-1. 2019-2020 Total Students Living in Zone Not Attending Zoned School is equal to the total number of administrative transfers, Charter School Students, and Private School Students. All Information provided by APS Demographics.

COLOR INDEX

Enrollment > 90% of Capacity Enrollment Between 75%-90% Enrollment between 65%-75% Enrollment between 55%-65% Enrollment between 45%-55%

School Capacity

2019-2020 Enrollment (Modified FTE-1) % FILL (ENROLLMENT/CAPACITY) 2019-2020 Total Students Living in Zone Not Attending Zoned School Inman

845 0%

Hope-Hill

497

336

68% 347

Mary Lin

693

708

102% 96

Morningside

737

946

128% 225

Springdale Park

693

782

113% 167 3,465 2,772 80% 835

TOTAL

BASE CLASSROOM CAPACITY

Grady Cluster School Name

School Capacity

2019-2020 Enrollment (Modified FTE-1) % FILL (ENROLLMENT/ CAPACITY) 2019-2020 Total Students Living in Zone Not Attending Zoned School Grady Howard

1,392

1,120

80% 427 BASE CLASSROOM CAPACITY

Cluster School Name

slide-39
SLIDE 39

39

Facilities Master Planning

Agenda

Spri Springdale Par ark ES

In Intr troduction & Ob Obje jectives Sc Scop

  • pe & Flo

Flow Prog

  • gress to
  • Date

Plan lanning Gu Guar ardrails Curr rrent Cap apac acity

  • En

Enrollm lment t For

  • recast

Qu Question an and Answer Ne Next xt St Steps

slide-40
SLIDE 40

40

Facilities Master Planning

School Enrollment Forecast Methodology

Current Elementary School Zone Housing Unit Mix

Data: City of Atlanta Parcel Files + CoStar Inventory

Base School Zone Growth/Decline Assumptions

Data: ARC Census Tract Household Growth Forecast

Modified School Zone Growth/Decline Assumptions

Data: City of Atlanta Permits + CoStar Pipeline + Other Planned Development (e.g., AH Sites) + Vacant Property Assumptions

Housing Unit Growth Forecast by Elementary Attendance Zone

X

Student Yield Analysis Factors: Housing Unit Type & Value Inputs to Derive Housing Unit Forecast Analytical Output Previous Analytical Output Student Enrollment Forecast by Elementary Zone

slide-41
SLIDE 41

41

Facilities Master Planning

Preliminary Takeaways/Conclusions

Pop

  • pulation Gr

Growth Sh Should ld Con

  • ntin

inue

ARC pop populatio ion for

  • recasts

indicate:

  • Substantial City-wide

population growth compared to recent decades

  • Continued pressure on APS

attendance zones with past enrollment growth

  • Potential for higher growth in
  • ther areas that have

experienced less development in the recent past

Sin ingle le-famil ily Dr Drives Stu Student Gr Growth

Apartments built and occupied since 2010 have, generally, had a relatively small impact on APS enrollment

  • < 3 APS students per 100

units*

  • average based on more than 26,000

units – individual properties can be

  • utliers

Affordable le Hou

  • using

Dr Driv ives Stu Student Gr Growth

  • Highest student yields

generally from lower-cost housing units, both single- and multifamily, owner and renter

  • APS enrollment will be

influenced by the City’s success/failure in supplying more affordable housing, particularly for families

slide-42
SLIDE 42

42

Facilities Master Planning

ARC Population Forecast for Atlanta

Total Population Change: 2016-2040

  • ARC’s population forecast

expects the City of Atlanta to add 180,000 residents, reaching a total population of nearly 690,000 by 2040

  • Darker shaded areas on this map

indicate census tracts with higher absolute increases in future population

Source: Atlanta Regional Commission Total Population Change by Census Tract

slide-43
SLIDE 43

43

Facilities Master Planning

ARC Population Forecast – by HS Cluster

0.0% 5.0% 10.0% 15.0% 20.0% 25.0% 30.0% 35.0% 40.0% 45.0% 5000 10000 15000 20000 25000 30000 35000

Population Change by HS Cluster (2016-2040)

Population Change % Change

North Atlanta & Grady 44% South Atlanta, Carver & Maynard Jackson 32% Douglass, Mays, Therrell & Washington 24%

Estimated % Distribution of Atlanta's Total Population Growth: 2016-2040

slide-44
SLIDE 44

44

Facilities Master Planning

FMP Population Forecast – by HS Cluster

Updated for

  • recast now

ac accounts for:

City adopted Atlanta City Design Plan Better understanding

  • f impact of the

Beltline on housing production, costs, and values Atlanta Housing plans to redevelop its former public housing sites Housing affordability now a major factor influencing growth Emergence of large redevelopment projects such as “the Gulch,” Ft. Mac, Turner Field, etc.

slide-45
SLIDE 45

45

Facilities Master Planning

FMP Population Forecast

The he up upda dated d AR ARC Cens ensus us tract le level vel po popu pulation forec

  • recasts

s alig align loc locat ations s of

  • f

fu future growth wit ith the e Atlan anta Cit ity Desig Design Plan lan.

Im Impli lications of

  • f th

the e updated ed forecast:

Shifts more growth to the West, South and Southwest parts of the city Locations of future growth are expected to cluster near major corridors and transit

Forecasts a continuation of historical growth patterns in Northeast and Northwest Atlanta

The City’s expected share

  • f future

regional growth will increase Atlanta’s population is projected to reach 800,000 by 2050 Growth impacts

  • f Atlanta

Housing’s activities will concentrate in West Atlanta

slide-46
SLIDE 46

46

Facilities Master Planning

Student Yield Analysis

  • Of the approximately 52,000 Atlanta resident

students attending public schools, we were able to use GIS to create a sample of nearly 43,300 APS (traditional and APS Charter) students that could be linked to the type and value of housing they occupy*

  • Summary Findings – Public School Children
  • 55% live in single-Family homes
  • 26% in multifamily apartments
  • 11% in condos, lofts, mobile homes & other
  • 93% live in the Fulton County portion of the

City

55.6% 6.1% 2.5% 2.6% 26.2% 6.9% Public School Students by Housing Type: (43,270 Students in Sample out

  • f a Total APS Enrollment of Approximately 52,000)

SF Detached Townhomes 2-4 Unit Bldgs Mobile Homes MF Apartments Other East Atlanta * Based on APS and tax assessment GIS data analysis The sample captures roughly 85% of all public and 55% of all private-school students

slide-47
SLIDE 47

47

Facilities Master Planning

Single-Family Student Yields

Fult lton Sample le

24,070 students in +/- 77,106 total SF detached homes

  • Average yi

yield = = 0.31 0.3122 APS PS stu tudents/unit ac across ss al all l un units Highest yields are from homes valued below $100,000 (0.367)

  • 67% of APS students who live in single-family homes occupy housing with

a taxable full value below $100,000

  • Lowest yields are from homes valued above $1.5 million (0.094)
  • Average stu

tudent-occupied hom home valu alues vary ry widely by y HS HS clu cluster r

  • Carver, Douglass, South Atlanta, and Washington < $35,000
  • North Atlanta and Grady > $600,000

De DeKalb lb Sample le

2,496 students live in 11,639 SF detached homes (estimated) = 0.214 0.214 students/unit

  • Average home value = $317,400
  • 64% of DeKalb students are in the Maynard Jackson cluster, 33% Grady,

2.4% not indicated

slide-48
SLIDE 48

48

Facilities Master Planning

Multifamily Apartment Student Yields

Observed 11,340 APS and 90 private school students in 119,650 MF units* (1,215 properties)

  • Average yi

yield = = 0.11 0.1104 APS PS stu tudents/unit ac across ss al all l un units in all building types

  • Dou

Dougla lass, , Mays, s, So South Atl tlanta, & Therrell ll (14,400 occupied apartments):

  • Average =

= 0.34 0.34 stu tudents/housing un unit it

  • Nor
  • rth

th Atl tlanta & Gr Grady (67,200 occupied apartments):

  • Average =

= 0.05 0.05 stu tudents/housing un unit it APS PS Stu Students s typically liv ive in n old

  • lder/lo

lower pr pric iced un units

  • Of APS student who live in apartments:

40% live in properties which contain a % of affordable/assisted units 49% live in properties where the average rent is under $1,000/month 59% live in properties where the average rent is under $1.25/SF

Only 3% 3% live in apartments where the average rent is more than $2.00/SF

*removed vacant, corporate, (college) student and senior housing - reducing the sample to 11,061 students in 100,188

  • ccupied units

Of APS student who live in apartments:

63% live in properties built

before 1980

  • 0.21 students/unit

7% 7%, live in units built since

2010

  • 0.027 students/unit

26,100 Atlanta apartments (24% of the City’s total) have been built and occupied since 2010

slide-49
SLIDE 49

49

Facilities Master Planning

Other Housing Types / Private Schools

Townhomes

  • 2,644 APS students in 6,554 total townhomes
  • 0.4

.4034 stu tudents per er unit it

2-4 Unit it Bu Build ildin ings

  • 1,086 students in 8,082 units
  • 0.1

.1344 per er unit it

Mobile ile Homes

  • 280 students in 1,182 units
  • 0.2

.2369 per er unit it

Priv rivate Sc Schools ls

  • Of the approximately 8,900 Atlanta resident students

attending private schools, we were able to use GIS to create a sample of +/- 4,950 students that could be linked to the type and value of housing they occupy

  • Students attended a total of 53 different private

schools

  • Of the sample:
  • 86% live in the North Atla

tlanta Cluster

  • 6% live in the Grady Cluster
  • 8% live in the remain

inin ing clusters

slide-50
SLIDE 50

50

Facilities Master Planning

School Enrollment Forecast Methodology

Student Yield Analysis Large Development Housing Unit Growth/Decline School Zone Housing Unit Growth/Decline Current Elementary School Zone Housing Mix Students by Grade X Student Cohort Survival Ratio Enrollment Projection Forecast by School

Housing + Demographic Enrollment Projection = =>

slide-51
SLIDE 51

51

Facilities Master Planning

Enrollment Forecast Cone of Uncertainty

Meth thodolo logy – Provide a hig high and a low level for future enrollment. This estimate range will increase as the forecast moves into the future. For

  • recasti

ting enrollment will be done for Traditional APS PS Sc Schools ls and for APS PS Par artner Sc Schools. Capacity for Cha Charter Sch Schools is set by charter agreements with APS. Priv rivate Sc Schoo

  • ol enrollment is assumed to remain in

proportion to the total APS Enrollment.

slide-52
SLIDE 52

52

Facilities Master Planning

Objectives

Goals ls an and In Input fr from Se Session Se Set One Plan lanning Gu Guardrails ils Approach to

  • Enrollment

For

  • recast

1 2 3

slide-53
SLIDE 53

53

Facilities Master Planning

Agenda

Spri Springdale Par ark ES

In Intr troduction Sc Scop

  • pe & Flo

Flow Prog

  • gress to
  • Date

Plan lanning Gu Guar ardrails Curr rrent Cap apac acity Enrollment For

  • recast
  • Que

uestio ion an and Ans nswer

Ne Next xt St Steps

slide-54
SLIDE 54

54

Facilities Master Planning

Question & Answer

Dob Dobbs s ES

slide-55
SLIDE 55

55

Facilities Master Planning

Feedback

Is Is th there anythin ing you wish ish to know or r understand better about th the Sc School l Guardrail ils, Methodolo logy? Is Is th there anythin ing you wish ish to know or r understand better about th the Forecast Trends and Methodolo logy?

Stay Updated wit ith Facili litie ies Master Pla lannin ing!

  • Submit Feedback & Questions

through Let’s Talk

  • Visit the FMP Website

https://www.atlantapublicschools.us/FMP

slide-56
SLIDE 56

56

Facilities Master Planning

Next Steps

Update Enrollment Forecast Models/School Recommendations Prepare for 3rd Round of Community Conversations Conduct 3rd Round of Community Conversations

slide-57
SLIDE 57

57

Facilities Master Planning

Community Conversation Schedule

Note: draft schedule & is subject to change

Updated: 10/18/2019

Topic Proposed Date Time Location Cluster Address Type Status Friday, August 30, 2019 9:00 am - 1:00 pm CLL

130 Trinity Ave, SW 30303

BOE Retreat: 9am-1pm Complete Wednesday, October 2, 2019 6:00 - 8:00 pm Mays

Mays

3450 Benjamin E. Mays Dr., SW 30331

Regional 6-8pm Complete Wednesday, October 16, 2019 6:00 - 8:00 pm Sutton Main

North Atlanta 2875 Northside Dr., NW 30305

Regional 6-8pm Complete Thursday, October 17, 2019 6:00 - 8:00 pm King MS

Jackson

545 Hill St., 30312

Regional 6-8pm Complete Wednesday, October 23, 2019 6:00 - 8:00 pm South Atlanta

South Atlanta 800 Hutchins Rd., SE 30315

Regional 6-8pm Confirmed Thursday, November 14, 2019 9:00 am - 1:00 pm CLL

130 Trinity Ave, SW 30303

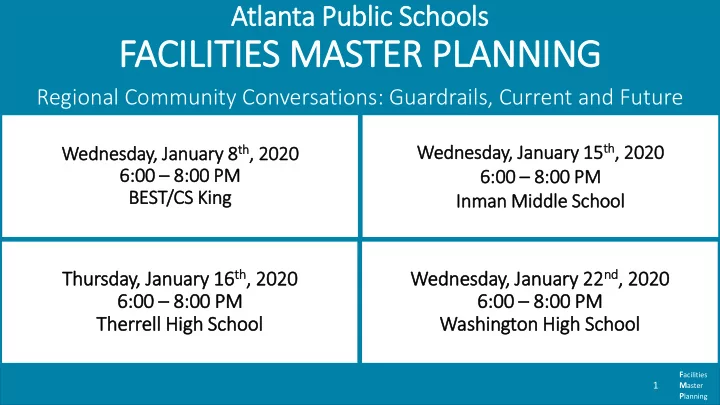
BOE Retreat: 9am-1pm Confirmed Wednesday, January 8, 2020 6:00 - 8:00 pm BEST/CSK

Douglass

1190 Northwest Dr., NW 30318

Regional 6-8pm Pending Wednesday, January 15, 2020 6:00 - 8:00 pm Inman

Grady

774 Virginia Ave., NE 30306

Regional 6-8pm Pending Thursday, January 16, 2020 6:00 - 8:00 pm Therrell

Therrell

3099 Panther Trail, SW 30311

Regional 6-8pm Pending Wednesday, January 22, 2020 6:00 - 8:00 pm Washington

Washington

45 Whitehouse Dr., NW 30314

Regional 6-8pm Pending Thursday, January 30, 2020 9:00 am - 4:00 pm CLL

130 Trinity Ave, SW 30303

BOE Retreat: 9am-4pm Confirmed Wednesday, March 4, 2020 6:00 - 8:00 pm South Atlanta Cluster 6-8pm Pending

Facilities Master Planning

Community Conversation Schedule

Existing Context Guidelines, Current and Forecasting