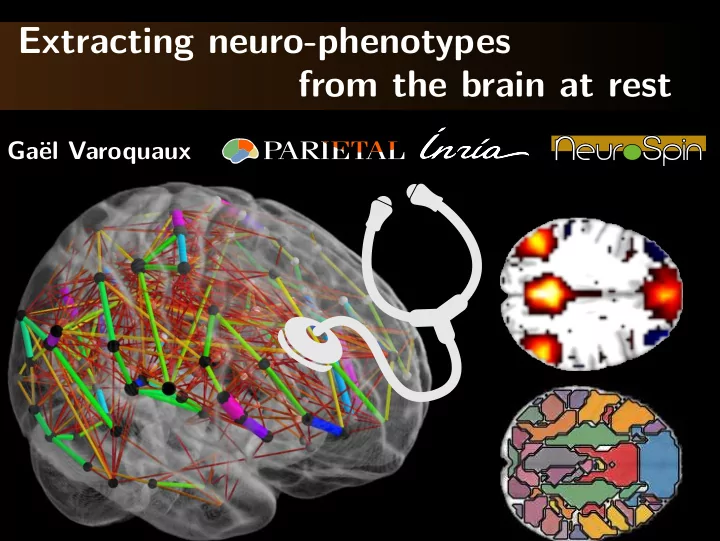
SLIDE 1
Extracting neuro-phenotypes from the brain at rest
Ga¨ el Varoquaux
SLIDE 2
Probing variations of the mind Psychiatry is defined by symptoms Diagnostic and Statistical Manual of Mental Disorders No known physio-pathology; Autism = ? Asperger Need quantitative phenotypes of brain function
G Varoquaux 2
SLIDE 3
Probing variations of the mind Psychiatry is defined by symptoms Diagnostic and Statistical Manual of Mental Disorders No known physio-pathology; Autism = ? Asperger Need quantitative phenotypes of brain function Population imaging with rest fMRI
UK Biobank [Miller... 2016]
Easy to set up reproducibly Suitable for diminished patients Connectivity captures traits
G Varoquaux 2
SLIDE 4
Functional connectomes No salient features in rest fMRI
G Varoquaux 3
SLIDE 5
Functional connectomes Define functional regions
[Varoquaux and Craddock 2013]
G Varoquaux 3
SLIDE 6
Functional connectomes Define functional regions Learn interactions
[Varoquaux and Craddock 2013]
G Varoquaux 3
SLIDE 7
Functional connectomes Define functional regions Learn interactions Detect differences
[Varoquaux and Craddock 2013]
G Varoquaux 3
SLIDE 8
Outline
1 Functional regions 2 The connectome matrix 3 Biomarkers of autism
G Varoquaux 4
SLIDE 9
1 Functional regions
Need functional regions for nodes ⇒ Spatial analysis
G Varoquaux 5
SLIDE 10
1 Functional regions
Available “on the market”
anatomical atlases, functional atlases, region extraction methods
G Varoquaux 5
SLIDE 11
1 Functional regions
Atlases based on anatomy Clustering tools Linear decomposition
G Varoquaux 5
SLIDE 12 1 Anatomical Anatomical atlases do not resolve functional structures
Harvard Oxford AAL
G Varoquaux 6
SLIDE 13 1 Clustering approaches Group together voxels with similar time courses
... ... ...
... ...
G Varoquaux 7
SLIDE 14
1 Clustering approaches K-Means Fast No spatial constraint
(smooth the data)
Related to [Yeo... 2011] Normalized cuts Slow
[Craddock... 2012]
Spatial constraints Very geometrical Ward clustering Very fast
(even with many clusters)
Spatial constraints
G Varoquaux 8
SLIDE 15
1 Clustering approaches
[Thirion... 2014]
K-Means Fast No spatial constraint
(smooth the data)
Related to [Yeo... 2011] Normalized cuts Slow
[Craddock... 2012]
Spatial constraints Very geometrical Ward clustering Very fast
(even with many clusters)
Spatial constraints Empirical choice Based on cluster stability and fit to data Large number of clusters: Ward Small number of clusters: Kmeans [Thirion... 2014]
G Varoquaux 8
SLIDE 16
1 Mixture models: linear decompositions Working hypothesis / model: Observing linear mixtures of networks at rest
Time courses G Varoquaux 9
SLIDE 17
1 Mixture models: linear decompositions Working hypothesis / model: Observing linear mixtures of networks at rest
Time courses Language G Varoquaux 9
SLIDE 18
1 Mixture models: linear decompositions Working hypothesis / model: Observing linear mixtures of networks at rest
Time courses Audio G Varoquaux 9
SLIDE 19
1 Mixture models: linear decompositions Working hypothesis / model: Observing linear mixtures of networks at rest
Time courses Visual G Varoquaux 9
SLIDE 20
1 Mixture models: linear decompositions Working hypothesis / model: Observing linear mixtures of networks at rest
Time courses Dorsal Att. G Varoquaux 9
SLIDE 21
1 Mixture models: linear decompositions Working hypothesis / model: Observing linear mixtures of networks at rest
Time courses Motor G Varoquaux 9
SLIDE 22
1 Mixture models: linear decompositions Working hypothesis / model: Observing linear mixtures of networks at rest
Time courses Salience G Varoquaux 9
SLIDE 23
1 Mixture models: linear decompositions Working hypothesis / model: Observing linear mixtures of networks at rest
Time courses Ventral Att. G Varoquaux 9
SLIDE 24
1 Mixture models: linear decompositions Working hypothesis / model: Observing linear mixtures of networks at rest
Time courses Parietal G Varoquaux 9
SLIDE 25
1 Mixture models: linear decompositions Working hypothesis / model: Observing linear mixtures of networks at rest
Time courses
Observe a mixture
How to unmix networks?
G Varoquaux 9
SLIDE 26 1 Spatial modes: ICA decomposition
time voxels time voxels time voxels
Y
+
E · S
=
25
N
Decomposing time series into: covarying spatial maps, S uncorrelated residuals, N p ICA: minimize mutual information across S
[Kiviniemi 2003, Beckmann 2005, Varoquaux 2010]
G Varoquaux 10
SLIDE 27 1 Spatial modes: ICA decomposition
time voxels time voxels time voxels
Y
+
E · S
=
25
N
Decomposing time series into: covarying spatial maps, S uncorrelated residuals, N p ICA: minimize mutual information across S
[Kiviniemi 2003, Beckmann 2005, Varoquaux 2010]
G Varoquaux 10
SLIDE 28 1 Spatial modes: ICA decomposition
time voxels time voxels time voxels
Y
+
E · S
=
25
N
Decomposing time series into: covarying spatial maps, S uncorrelated residuals, N Sparse decompositions: sparse penalty on maps
[Kiviniemi 2003, Beckmann 2005, Varoquaux 2010]
G Varoquaux 10
SLIDE 29 1 ICA versus sparse decompositions ICA
- 1. Select signal of interest
- 2. Select “maximaly independent” ICs
Sparse decomposition
ˆ E, ˆ S = argmin
S, E
2 + λ
Data fit Penalization: sparse maps Joint estimation of signal space + components
G Varoquaux 11
SLIDE 30 1 From group to subject networks MSDL
[Varoquaux... 2011, Abraham... 2013]
Multi-Subject Dictionary Learning
argmin
Es,Ss,S
Fro + µSs − S2 Fro
Data fit Subject variability Penalization: inject structure
G Varoquaux 12
SLIDE 31 1 From group to subject networks MSDL
[Varoquaux... 2011, Abraham... 2013]
Multi-Subject Dictionary Learning
argmin
Es,Ss,S
Fro + µSs − S2 Fro
Data fit Subject variability Penalization: inject structure Create a region-forming penalty: Original Clustering Total-variationg
G Varoquaux 12
SLIDE 32
Downloadable from Parietal webpage http://team.inria.fr/parietal
White matter Vascular system Inner nuclei Functional network Visual and motor system
SLIDE 33
[Abraham... 2013]
Brain parcellations
MSDL Group ICA Ward K-Means
SLIDE 34
[Abraham... 2013]
Brain parcellations
MSDL Group ICA Ward K-Means
SLIDE 35
[Abraham... 2013]
Brain parcellations
MSDL Group ICA Ward K-Means
SLIDE 36 Functional regions
AAL Smith 2009 ICAs Craddock 2011 Ncuts Abraham 2013 TV-MSDL Ward Harvard- Oxford High model
K-Means Varoquaux 2011 Smooth- MSDL Yeo 2011 G Varoquaux 15
SLIDE 37 Functional regions
AAL Smith 2009 ICAs Craddock 2011 Ncuts Abraham 2013 TV-MSDL Ward Harvard- Oxford High model
K-Means Varoquaux 2011 Smooth- MSDL Yeo 2011 G Varoquaux 15
SLIDE 38
2 The connectome matrix
How to capture and represent interactions?
G Varoquaux 16
SLIDE 39 2 Correlations: observations and indirect effects
Observations
Correlation
1 2 3 4
Covariance: scaled by variance
Direct connections
Partial correlation
1 2 3 4
Inverse covariance: scaled by partial variance
G Varoquaux 17
SLIDE 40
2 Correlations: observations and indirect effects
Observations
Correlation
Direct connections
Partial correlation
G Varoquaux 17
SLIDE 41 2 Inverse covariance and graphical model Gaussian graphical models Zeros in inverse covariance give conditional independence Σ−1
i,j = 0
⇔ xi, xj independent conditionally on {xk, k = i, j} Sparse inverse covariance Estimator imposes zeros
[Smith... 2011, Varoquaux... 2010b]
Shrunk estimator Estimates closer to 0
[Varoquaux and Craddock 2013] G Varoquaux 18
SLIDE 42 2 Differences in correlations across subjects
5 10 15 20 25 5 10 15 20 25 5 10 15 20 25 5 10 15 20 25 5 10 15 20 25 5 10 15 20 25 5 10 15 20 25 5 10 15 20 25
Correlation matrices
5 10 15 20 25 5 10 15 20 25 5 10 15 20 25 5 10 15 20 25 5 10 15 20 25 5 10 15 20 25 5 10 15 20 25 5 10 15 20 25
Partial correlation matrices 3 controls, 1 severe stroke patient Which is which?
G Varoquaux 19
SLIDE 43 2 Differences in correlations across subjects
5 10 15 20 25 5 10 15 20 25Control 5 10 15 20 25 5 10 15 20 25Control 5 10 15 20 25 5 10 15 20 25Control 5 10 15 20 25 5 10 15 20 25Large lesion
Correlation matrices
5 10 15 20 25 5 10 15 20 25Control 5 10 15 20 25 5 10 15 20 25Control 5 10 15 20 25 5 10 15 20 25Control 5 10 15 20 25 5 10 15 20 25Large lesion
Partial correlation matrices Spread-out variability in correlation matrices Noise in partial-correlations Strong dependence between coefficients
[Varoquaux... 2010a] G Varoquaux 19
SLIDE 44
2 A toy model of differences in connectivity Two processes with different partial correlations K1: K1 − K2: Σ1: Σ1 − Σ2:
+ jitter in observed covariance
MSE(K1 − K2): MSE(Σ1 − Σ2): Non-local effects and non homogeneous noise
G Varoquaux 20
SLIDE 45 2 Reparametrization for uniform error geometry Disentangle parameters (edge-level connectivities) Connectivity matrices form a manifold ⇒ project to tangent space
Controls Patient
dΣ
Manifold T a n g e n t
dΣ = Σ− 1/
2
Ctrl ΣPatientΣ− 1/
2
Ctrl
G Varoquaux 21
SLIDE 46
2 Reparametrization for uniform error geometry The simulations K1 − K2: Σ1 − Σ2: dΣ: MSE(dΣ): Semi-local effects and homogeneous noise
G Varoquaux 22
SLIDE 47 2 Which parametrization capture differences
5 10 15 20 25 5 10 15 20 25Control 5 10 15 20 25 5 10 15 20 25Control 5 10 15 20 25 5 10 15 20 25Control 5 10 15 20 25 5 10 15 20 25Large lesion
Correlation matrices
5 10 15 20 25 5 10 15 20 25Control 5 10 15 20 25 5 10 15 20 25Control 5 10 15 20 25 5 10 15 20 25Control 5 10 15 20 25 5 10 15 20 25Large lesion
Partial correlation matrices
5 10 15 20 25 5 10 15 20 25Control 5 10 15 20 25 5 10 15 20 25Control 5 10 15 20 25 5 10 15 20 25Control 5 10 15 20 25 5 10 15 20 25Large lesion
Tangent-space embedding
[varoquaux 2010] G Varoquaux 23
SLIDE 48
3 Biomarkers of autism
from connectomes
G Varoquaux 24
SLIDE 49 3 Intersite autism neurophenotypes Predicting diagnostic status a good success metric Multi-site large autism dataset: ABIDE Autism Spectrum Disorder
[Di Martino... 2014]
⇒ Patient/Control classification 16 sites ∼ 1000 subjects Biomarkers robust to inter-site variations Cross-validation predicting to new sites
Training set T esting set
G Varoquaux 25
SLIDE 50
A connectome classification pipeline
RS-fMRI
Functional connectivity Time series
2 4 3 1
Diagnosis
ROIs
1 ROI definition 2 Time-series extraction 3 Connectivity matrices 4 Supervised learning
[Abraham... 2016]
G Varoquaux 26
SLIDE 51
A connectome classification pipeline
RS-fMRI
Functional connectivity Time series
2 4 3 1
Diagnosis
ROIs
1 ROI definition 2 Time-series extraction 3 Connectivity matrices 4 Supervised learning
[Abraham... 2016]
Prediction accuracy (%)
Seen sites 67±3 Unseen sites 67±5
What is important to predict?
G Varoquaux 26
SLIDE 52
A connectome classification pipeline
RS-fMRI
Functional connectivity Time series
2 4 3 1
Diagnosis
ROIs
1 ROI definition 2 Time-series extraction 3 Connectivity matrices 4 Supervised learning
[Abraham... 2016]
Prediction accuracy (%)
Seen sites 67±3 Unseen sites 67±5
What is important to predict?
G Varoquaux 26
SLIDE 53
3 ROI definition: impact of choice
RS-fMRI
Functional connectivity Time series
2 4 3 1
Diagnosis
ROIs
1 ROI definition 2 Time-series extraction 3 Connectivity matrices 4 Supervised learning
G Varoquaux 27
SLIDE 54
3 ROI definition: impact of choice
RS-fMRI
Functional connectivity Time series
2 4 3 1
Diagnosis
ROIs
1 ROI definition 2 Time-series extraction 3 Connectivity matrices 4 Supervised learning
G Varoquaux 27
SLIDE 55
3 Time-series extraction
Time series
2
RS-fMRI
Functional connectivity
4 3 1
Diagnosis
ROIs
1 ROI definition 2 Time-series extraction 3 Connectivity matrices 4 Supervised learning Remove motion regressors Compcorr Global mean regression Empirically: different ways work
G Varoquaux 28
SLIDE 56
3 Functional-connectivity matrix
Time series
2
RS-fMRI
4 1
Diagnosis
ROIs Functional connectivity
3 1 ROI definition 2 Time-series extraction 3 Connectivity matrices 4 Supervised learning
G Varoquaux 29
SLIDE 57
3 Functional-connectivity matrix
Time series
2
RS-fMRI
4 1
Diagnosis
ROIs Functional connectivity
3 1 ROI definition 2 Time-series extraction 3 Connectivity matrices 4 Supervised learning Correlation matrix? Partial correlation matrix? Tangent-space embedding?
[Varoquaux... 2010a]
G Varoquaux 29
SLIDE 58
3 Functional-connectivity matrix
Time series
2
RS-fMRI
4 1
Diagnosis
ROIs Functional connectivity
3 1 ROI definition 2 Time-series extraction 3 Connectivity matrices 4 Supervised learning
G Varoquaux 30
SLIDE 59
3 Supervised learning method
Functional connectivity Time series
3 4
Diagnosis
2
RS-fMRI
1
ROIs
1 ROI definition 2 Time-series extraction 3 Connectivity matrices 4 Supervised learning Ridge classifier SVC ℓ2 penalized SVC ℓ1 penalized
G Varoquaux 31
SLIDE 60
3 Supervised learning method: impact of choice
Functional connectivity Time series
3 4
Diagnosis
2
RS-fMRI
1
ROIs
1 ROI definition 2 Time-series extraction 3 Connectivity matrices 4 Supervised learning
G Varoquaux 32
SLIDE 61
Importance of pipeline steps
RS-fMRI
Functional connectivity Time series
2 4 3 1
Diagnosis
ROIs
1 ROI definition 2 Time-series extraction 3 Connectivity matrices 4 Supervised learning
G Varoquaux 33
SLIDE 62
Importance of pipeline steps
RS-fMRI
Functional connectivity Time series
2 4 3 1
Diagnosis
ROIs
1 ROI definition 2 Time-series extraction 3 Connectivity matrices 4 Supervised learning
G Varoquaux 33
SLIDE 63
MSDL atlas
SLIDE 64
More data is better
Accuracy Fraction of subjects used
Multivariate processing of a 1Tb of heterogeneous data is worth the trouble
SLIDE 65
3 Pyschiatric neurophenotypes from rest-fMRI Viable from data accumulation ABIDE is a post-hoc aggregate Prediction across sites
SLIDE 66
3 Pyschiatric neurophenotypes from rest-fMRI Viable from data accumulation ABIDE is a post-hoc aggregate Prediction across sites Not (yet) for clinical diagnostic Capture neural signatures of disorders ⇒ Towards a redefinition of disorders Requires huge data accumulation
SLIDE 67
nilearn: machine learning for neuroimaging
ni
Make it easy for Neuroscientists to use machine learning Machine learning research to do neuroimaging Design goal: runs out of the box Strong points Fast and versatile High-quality brain plotting Simple syntax Meaningful neuroimaging analysis in examples. Try it – http://nilearn.github.io
[Abraham... 2014]
SLIDE 68
@GaelVaroquaux
Neurophenotypes from rest Recipe for good neurophenotypes Choice of regions critical (learn them) Tangent-space embedding Standard SVM ni
SLIDE 69
@GaelVaroquaux
Neurophenotypes from rest Recipe for good neurophenotypes Choice of regions critical (learn them) Tangent-space embedding Standard SVM ni Dictionary learning MSDL Good definitions of regions Validation is very hard
SLIDE 70
@GaelVaroquaux
Neurophenotypes from rest Recipe for good neurophenotypes Choice of regions critical (learn them) Tangent-space embedding Standard SVM ni Dictionary learning MSDL Good definitions of regions Validation is very hard Prediction of autism across sites
[Abraham... 2016]
SLIDE 71 References I
- A. Abraham, E. Dohmatob, B. Thirion, D. Samaras, and
- G. Varoquaux. Extracting brain regions from rest fMRI with
total-variation constrained dictionary learning. In MICCAI, page
- 607. 2013.
- A. Abraham, F. Pedregosa, M. Eickenberg, P. Gervais, A. Mueller,
- J. Kossaifi, A. Gramfort, B. Thirion, and G. Varoquaux.
Machine learning for neuroimaging with scikit-learn. Frontiers in neuroinformatics, 8, 2014.
- A. Abraham, M. Milham, A. Di Martino, R. C. Craddock,
- D. Samaras, B. Thirion, and G. Varoquaux. Deriving robust
biomarkers from multi-site resting-state data: An autism-based
- example. bioRxiv, page 075853, 2016.
- R. C. Craddock, G. A. James, P. E. Holtzheimer, X. P. Hu, and
- H. S. Mayberg. A whole brain fMRI atlas generated via spatially
constrained spectral clustering. Human brain mapping, 33(8): 1914–1928, 2012.
SLIDE 72 References II
- A. Di Martino, C.-G. Yan, Q. Li, E. Denio, F. X. Castellanos,
- K. Alaerts, J. S. Anderson, M. Assaf, S. Y. Bookheimer,
- M. Dapretto, ... The autism brain imaging data exchange:
towards a large-scale evaluation of the intrinsic brain architecture in autism. Molecular psychiatry, 19:659, 2014.
- K. L. Miller, F. Alfaro-Almagro, N. K. Bangerter, D. L. Thomas,
- E. Yacoub, J. Xu, A. J. Bartsch, S. Jbabdi, S. N. Sotiropoulos,
- J. L. Andersson, ... Multimodal population brain imaging in the
uk biobank prospective epidemiological study. Nature Neuroscience, 2016.
- S. Smith, K. Miller, G. Salimi-Khorshidi, M. Webster,
- C. Beckmann, T. Nichols, J. Ramsey, and M. Woolrich. Network
modelling methods for fMRI. Neuroimage, 54:875, 2011.
- B. Thirion, G. Varoquaux, E. Dohmatob, and J. Poline. Which
fMRI clustering gives good brain parcellations? Name: Frontiers in Neuroscience, 8:167, 2014.
SLIDE 73 References III
- G. Varoquaux and R. C. Craddock. Learning and comparing
functional connectomes across subjects. NeuroImage, 80:405, 2013.
- G. Varoquaux, F. Baronnet, A. Kleinschmidt, P. Fillard, and
- B. Thirion. Detection of brain functional-connectivity difference
in post-stroke patients using group-level covariance modeling. In MICCAI, pages 200–208. 2010a.
- G. Varoquaux, A. Gramfort, J. B. Poline, and B. Thirion. Brain
covariance selection: better individual functional connectivity models using population prior. In NIPS. 2010b.
- G. Varoquaux, A. Gramfort, F. Pedregosa, V. Michel, and
- B. Thirion. Multi-subject dictionary learning to segment an atlas
- f brain spontaneous activity. In Inf Proc Med Imag, pages
562–573, 2011.
SLIDE 74 References IV
- B. Yeo, F. Krienen, J. Sepulcre, M. Sabuncu, ... The organization
- f the human cerebral cortex estimated by intrinsic functional
- connectivity. J Neurophysio, 106:1125, 2011.