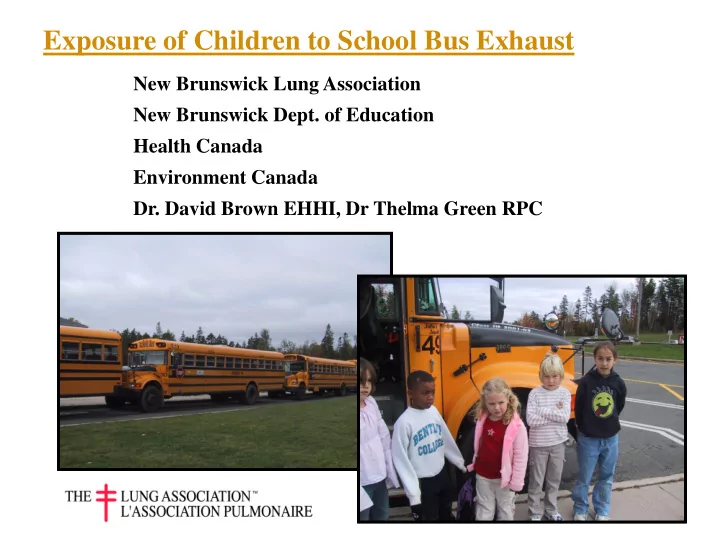

Exposure of Children to School Bus Exhaust New Brunswick Lung Association New Brunswick Dept. of Education Health Canada Environment Canada Dr. David Brown EHHI, Dr Thelma Green RPC
Diesel emissions are a complex mixture of hazardous particles, gases and vapours CO2 PM1.0, PM2.5 CO, VOCs including polycyclic aromatic hydrocarbons benzene, 1,3-butadiene, toluene and xylene, aldehydes
Health effects Symptoms most often associated with diesel exhaust exposure are: irritation of the eyes and nose broncho-constriction cough and signs of laboured breathing chest tightness and wheezing Diesel exhaust is a probable human carcinogen.
Population health Respiratory diseases are increasing in North America and are becoming one of the leading causes of death (Statistics Canada, 1997) Air pollution plays an important role in the development of several respiratory conditions: infections such as bronchitis and pneumonia exacerbation of chronic obstructive lung disease and asthma decreased lung function and lung growth lung cancer It also contributes to higher rate s of heart attacks.
Asthma and children Studies have shown a causal relationship between traffic congestion, diesel exhaust and asthma (English et al., 1999; Ciccone et al., 1998, cited in Wargo et al., 2002). Asthma accounts for one quarter of school absenteeism and is the most common chronic disease plaguing children. In 2000/01, 8.7% of Canadians four years of age and over suffered from asthma. Between 1995 and 1999 the prevalence of asthma had increased by 14% among children between ages 4 and 11. It occurs currently in approximately 7 to 10% of children (Health Canada, 2002; Canadian Lung Association, 2004) In New Brunswick, in 2000/01, there were 8652 young people between the ages of 12 and 19 suffering from asthma.
School Bus Study Objectives To determine the exposure of New Brunswick children to fuel exhaust-related pollutants on their daily way to school. To improve our understanding of the exposure of New Brunswick school children to diesel exhaust relative to the age of the bus and the length of the bus route. To offer policy recommendations based on the findings.
Methods Compounds measured were PM 1.0, PM 2.5, black carbon, and volatile organic compounds. A Dust Trak air monitor sampled continuous levels of particulate matter 2.5 g and smaller. A P-Trak sampled PM 1.0 g and smaller. An aethalometer measured levels of black carbon (BC) and UV- absorbing aromatic material. SUMMA cannisters were used to take “total - trip” samples of volatile organic compounds (VOCs). The research assistants recorded all relevant events in a log for each entire day. Data exists for 63 sampling days, over 75 bus rides and 11 walking routes.
Results Riding the bus exposes children to 3-5 times higher levels of PM2.5, and 2-3 times higher PM1.0 than does walking to school. Levels of VOCs were higher on buses but the variability could not be explained by age of bus or duration of route. Short bus rides have higher mean and maximum exposures to PM2.5. Long bus rides had higher cumulative exposures to PM2.5, PM1.0 and black carbon compared with short rides. The age, mileage, and type of fuel injection system (mechanical or electric) did not strongly affect exposures to PM2.5. Colder temperatures tended to increase PM1.0 and higher humidity increased PM2.5. Higher ambient PM2.5 tended to increase PM2.5 inside buses.
Riding the bus Examples PM2.5 exposure ug/m3 PM 2.5 100 120 140 20 40 60 80 0 12:52:33 13:01:33 13:10:33 13:19:33 13:28:33 13:37:33 13:46:33 13:55:33 14:04:33 14:13:33 Walking 14:22:33 14:31:33 14:40:33 14:49:33 ug/m3 PM 2.5 100 120 140 20 40 60 80 ug/m3 PM2.5 0 7:53:05 100 120 140 20 40 60 80 7:58:05 0 8:03:05 6:58:33 8:08:05 7:07:33 8:13:05 8:18:05 7:16:33 8:23:05 8:28:05 7:25:33 8:33:05 7:34:33 8:38:05 8:43:05 7:43:33 8:48:05 8:53:05 7:52:33 8:58:05 8:01:33 9:03:05 9:08:05 8:10:33 9:13:05 9:18:05 8:19:33 9:23:05 8:28:33 9:28:05 9:33:05 8:37:33 9:38:05 9:43:05 8:46:33 9:48:05 8:55:33 9:53:05
10000 15000 20000 25000 30000 35000 40000 45000 Same bus ride: PM1.0, Black carbon, PM2.5 5000 0 ug/m3 PM 2.5 11:05:25 100 120 140 20 40 60 80 11:12:25 0 10:46:48 11:19:25 PM1.0 counts/m3 10:55:48 11:26:25 11:33:25 11:04:48 11:40:25 11:13:48 11:47:25 11:22:48 11:54:25 11:31:48 12:04:41 11:40:48 12:11:41 11:49:48 12:18:41 11:58:48 12:25:41 12:07:48 12:32:41 12:16:48 12:39:41 12:25:48 12:46:41 12:34:48 1000 1500 2000 2500 500 12:43:48 0 10:51 10:59 PM2.5 ug/m3 11:07 11:15 11:23 Black Carbon ng/m3 11:31 11:39 11:47 11:55 12:03 12:11 12:19 12:27 12:35 12:43 12:51
Recommendations Eliminate bus idling Implement no-idling policy for all vehicles on school grounds Avoid caravanning Consider reducing the number of stops or relocating stops to areas with lower traffic density Locate exhaust pipes to upper left of rear of bus Air-filtering systems should be considered Retrofit diesel buses to achieve lower emissions New buses should have lowest emissions possible
Recommend
More recommend