Experimental Study on the Heat Transfer Characteristics of CNF - - PDF document

experimental study on the heat transfer characteristics
SMART_READER_LITE
LIVE PREVIEW

Experimental Study on the Heat Transfer Characteristics of CNF - - PDF document

Transactions of the Korean Nuclear Society Virtual Spring Meeting July 9-10, 2020 Experimental Study on the Heat Transfer Characteristics of CNF Nanofluids during Quenching Hundong Choi, Hyelyung Lee, Minjung Cho, Yeeun Cho, Kwon-yeong Lee*


slide-1
SLIDE 1

Experimental Study on the Heat Transfer Characteristics of CNF Nanofluids during Quenching

Hundong Choi, Hyelyung Lee, Minjung Cho, Yeeun Cho, Kwon-yeong Lee* School of Mechanical and control Engineering, Handong Global University, Pohang, 151-742, Korea

*Corresponding author: kylee@handong.edu

  • 1. Introduction

Quenching is the process of cooling a hot object rapidly by exposing it to a coolant. Quenching is important to the safety of a nuclear power plant such as the event of a loss-of-coolant accident (LOCA). The present study focuses on a CNF nanofluid, which is considered as highly strong, high thermal and chemical stable, high durable and semi-permanent product since it is a natural material from woods. Unlike other metallic nanofluids, it has the advantage of high dispersibility in water and increasing the critical heat flux up to 69.4% in 0.1 wt% CNF solutions when compared to CHF in pure water.[1] In quenching, an acceleration of the transition from film boiling to nucleate boiling is critical because the formation of the vapor blanket around the heated surface results in a considerate reduction in the cooling performance due to its low thermal conductivity. In response, many researchers have reported that nanofluids accelerates the transition from film boiling to nucleate

  • boiling. They also found that the water-based nanofluids

increase the surface roughness and the wettability enhancement due to nanoparticle deposition, which is known to be one of the factors that enhances CHF

  • enhancement. The nanoparticle deposition on the surface

prevents the formation of vapor film and results in quick quenching process.[2] Therefore, the purpose of this study is to confirm and observe the heat transfer characteristics on the cooling surface of CNF compared with DI water and seawater.

  • 2. Methods and Results

2.1 Experiment setup

  • Fig. 1. Experimental apparatus
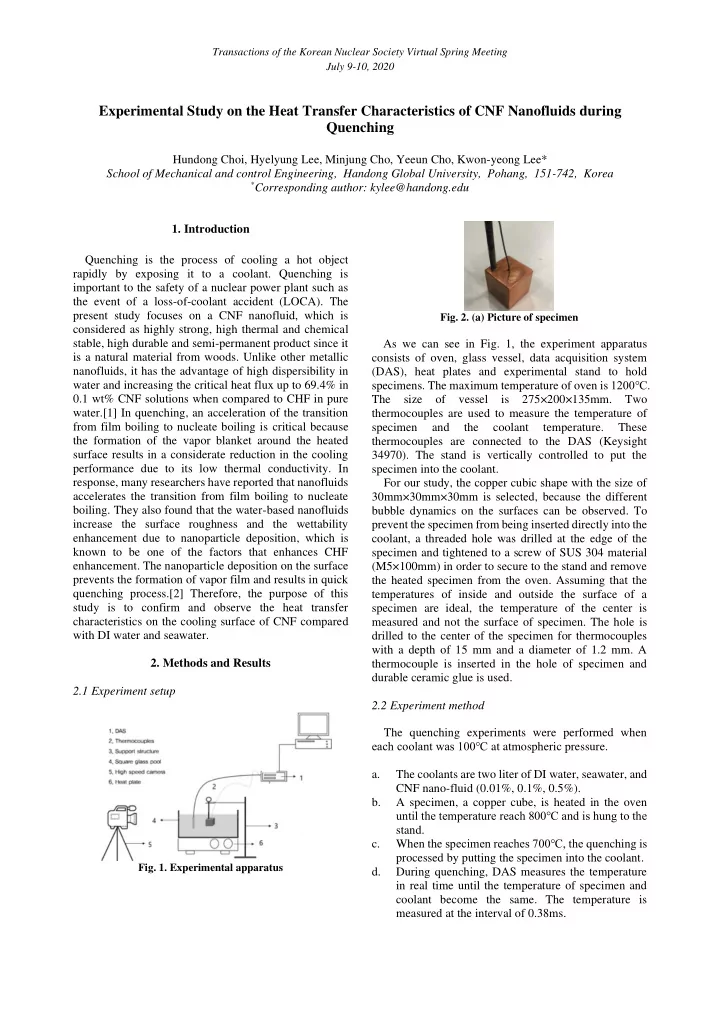
  • Fig. 2. (a) Picture of specimen

As we can see in Fig. 1, the experiment apparatus consists of oven, glass vessel, data acquisition system (DAS), heat plates and experimental stand to hold

  • specimens. The maximum temperature of oven is 1200℃.

The size

  • f

vessel is 275×200×135mm. Two thermocouples are used to measure the temperature of specimen and the coolant temperature. These thermocouples are connected to the DAS (Keysight 34970). The stand is vertically controlled to put the specimen into the coolant. For our study, the copper cubic shape with the size of 30mm×30mm×30mm is selected, because the different bubble dynamics on the surfaces can be observed. To prevent the specimen from being inserted directly into the coolant, a threaded hole was drilled at the edge of the specimen and tightened to a screw of SUS 304 material (M5×100mm) in order to secure to the stand and remove the heated specimen from the oven. Assuming that the temperatures of inside and outside the surface of a specimen are ideal, the temperature of the center is measured and not the surface of specimen. The hole is drilled to the center of the specimen for thermocouples with a depth of 15 mm and a diameter of 1.2 mm. A thermocouple is inserted in the hole of specimen and durable ceramic glue is used. 2.2 Experiment method The quenching experiments were performed when each coolant was 100℃ at atmospheric pressure. a. The coolants are two liter of DI water, seawater, and CNF nano-fluid (0.01%, 0.1%, 0.5%). b. A specimen, a copper cube, is heated in the oven until the temperature reach 800℃ and is hung to the stand. c. When the specimen reaches 700℃, the quenching is processed by putting the specimen into the coolant. d. During quenching, DAS measures the temperature in real time until the temperature of specimen and coolant become the same. The temperature is measured at the interval of 0.38ms.

Transactions of the Korean Nuclear Society Virtual Spring Meeting July 9-10, 2020

slide-2
SLIDE 2

e. High speed camera is used to check the boiling phenomena around the specimen during quenching. 2.3 Data analysis During quenching process, the heat flux was predicted using the lumped capacitance method by the following expression (1).[3] −𝒊𝑩(𝑼 − 𝑼𝒕𝒃𝒖) = 𝝇𝑾𝒅

𝒆𝑼 𝒆𝒖

(1) 𝑪𝒋 =

𝒊𝑴 𝒍

(2) When using the lumped capacitance method as shown in equation (1), Biot number, equation (2), must be

  • considered. Biot number is an indicator that ignores

conductive thermal resistance in a solid when the conduction in a solid metal is much greater than the convection around a solid. If the Biot number is less than 0.1, then this analysis can be performed with an error of less than 5%.[4] The Biot number of the highest value of h obtained in the experiment was 0.0392, less than 0.1.

  • 3. Result and Discussion

3.1 Different heat flux regime The quenching curve of each coolant can be divided into 3 regimes, film boiling regime, transition boiling regime, and nucleate boiling regime. Three regimes were divided based on the slope of the cooling curve, which is the magnitude of temperature change over time. The shape and size of bubble was additionally analyzed through images since the size, shape, and frequency of the bubbles are good indicators for deciding the heat flux regime.

  • Fig. 3. Average cooling curves of DI water (a) film boiling

regime, (b) transition boiling regime, (c) nucleate boiling regime

As shown in Fig. 3., (a) is a film boiling regime where a stable vapor film forms on the surface when the surface temperature is higher than that of the LFP (Leidenfrost Point). In this regime, the low heat transfer conductivity is shown due to the vapor film. (b) is a transition boiling regime, also known as a partial film boiling or a partial nuclear boiling regime, where the vapor film begins to break when the surface temperature is lower than LFP. In this regime, the rate of heat transfer increases rapidly as the vapor film breaks. (c) is a nucleate boiling regime where the most rapid heat transfer occurs. In this regime, small and dense bubbles are created. 3.2 Quenching behavior Each experiment with different solutions was conducted three times. The slope of average cooling graphs shown in Fig. 4 are analyzed and divided into three different boiling regimes. The quenching in coolants exhibits the different behavior, such as the cooling time and slope of the graph. By the slope of the graphs, the regimes were analyzed, and time taken for each coolant in every regime is numerically represented in Table 1. The time taken for each regime is also displayed in percentage to indicate the portion of the entire regime. In addition, every regime in boiling curves is colored as shown in Fig. 5.

  • Fig. 4. The average cooling curves with different coolants

Table I: Duration of regimes Coolants Nucleate Regime [s] Transition Regime [s] Film Regime [s] Total [s] DI water 4.07 (6.52%) 4 (6.40%) 54.35 (87.07%) 62.42 (100%) CNF 0.01% 5.4 (8.87%) 5.48 (9.52%) 50.02 (82.13%) 60.9 (100%) CNF 0.1% 6.32 (10.31%) 7.26 (11.85%) 47.69 (77.84%) 61.27 (100%) CNF 0.5% 5.07 (7.28%) 3.69 (6.30%) 60.86 (87.40%) 69.63 (100%) Sea water 3.59 (10.23%) 14.14 (40.31%) 17.35 (49.46%) 35.08 (100%)

As shown in Fig. 4., the durations of cooling are different for each solution. The film boiling part of the coolants are the longest for all cases when compared to the other regimes. This indicates that the time taken to break the film vapor is long. The transition regime of seawater is the longest. While the nucleate boiling has been increased as the concentration increased from 0.01% to 0.1%, the part decreased again when the concentration is at 0.5%. As a whole, the quenching time increases as the concentration increases. As the concentration of the dispersed nanofluid increases, the heat resistance of the

Transactions of the Korean Nuclear Society Virtual Spring Meeting July 9-10, 2020

slide-3
SLIDE 3

fluid increases. Moreover, the nanofluid coating film formed on the surface hinders heat transfer, and increases the heat resistance of the surface, thereby reducing heat

  • transfer. [5]

As shown in Fig. 5., the different regimes start at different temperature for each coolant. The transition regime is extremely longer, while the transition starts at temperature in a range of 100oC and 200oC for the other

  • coolants. In violent reactions in DI water and seawater,

the oxides fell off, while the amount of CuO falling off the specimens in the CNF solution was relatively small. This seems to have lowered the extent of the boiling reaction by CNF nanoparticles floating near the specimen. Also, the faster cooling rate in seawater is due to the zeta- potential effect between the seawater and the copper

  • specimen. The electrical double layer (EDL) between

seawater and copper creates a negative charge distribution over the copper surface, which creates a positively charged ion distribution between copper and

  • seawater. This prevents stable film boiling and allows

quenching to start transition boiling faster [6]. However, the CHF in the CNF 0.5% solution is highest, the entire cooling time of CNF 0.5% solution and water are similar. It is also notable that film regime time is the longest with CNF 0.5% solution. This phenomenon will be discussed in next section. The cooling mechanism of CNF 0.5% solution is much stable than seawater. The stability of system matters during severe accident.

  • Fig. 5. The cooling curves with different coolants, (a) DI

water, (b) CNF 0.01%, (c) CNF 0.1%, (d) CNF 0.5%, (e) seawater and the heat flux graph with different coolants, (f) DI water, (g) CNF 0.01%, (h) CNF 0.1%, (i) CNF 0.5%, (j) seawater

3.3 Reproductivity of Quenching behavior in CNF solutions

  • Fig. 6. Repeatability tests for the cooling curve: (a) DI

water, (b) CNF 0.01%, (c) CNF 0.1%, (d) CNF 0.5%, (e) seawater and for the boiling curve: (f) DI water, (g) CNF 0.01%, (h) CNF 0.1%, (i) CNF 0.5%, (j) seawater

To prove the reproductivity of the experiment, three experiments for each coolant were conducted with a copper specimen. As shown in Fig. 6. (a), (b), (c), (d), (e), three cooling curves of each coolant have a similar shape. The mean deviation of cooling graphs is 9.5 for DI water, 7.3 for CNF 0.1%, and 36.5 for seawater. There was a large deviation in seawater compared to other coolants. This is because a highly turbulent and unstable flow pattern affects the cooling of hot copper specimen in the

  • seawater. In addition, Fig 6. shows that the higher heat

flux values in the third experiment of DI water, CNF 0.1% and in the second experiment of seawater. All cases showed oxidized surfaces of the specimen. During the experiment, when the temperature of the specimens are between 100°C and 300°C, the copper oxide film on the surfaces due to oxidation could not bear the repeated

Transactions of the Korean Nuclear Society Virtual Spring Meeting July 9-10, 2020

slide-4
SLIDE 4

experiment and were broken faster than the other experiments. As shown in Fig 7., the film of oxidized copper did not come off even after the quenching for CNF solutions, while the clean surfaces of copper can be seen in case of water and seawater. Furthermore, the more film remains as the concentration increases. This is because CNF has property that collect and deposit the oxidized particles on itself.[7] The thickness of oxidized surface in Fig. 7 increases as the concentration of CNF solution increases. The attached oxidized surface delays the transition regime to take place as stated in Table I. This property is useful when the severe accident in nuclear power plant

  • ccurs. The floating particles of oxidized metal could

block the water suction or even water supply pipe for cooling the core.

  • Fig. 7. Visualizations after quenching in (a) DI water, (b)

0.01% CNF, (c) 0.1% CNF, and (d) 0.5% CNF, (e) seawater

  • 4. Conclusions

The quenching experiments were conducted in different solutions, DI water, CNF solutions (0.01%, 0.1%, 0.5%), and seawater. The heat characteristics of each solutions were analyzed using heat flux graphs and the observation during quenching. Although the cooling time is the fastest in seawater, it has been found thatthe 0.5 % CNF solution has advantages in constant cooling mechanism through continuous quenching when compared to the other solutions and similar cooling performance when compared with water. REFERENCES

[1] Hwang et al. (2019) ‘Enhancement of nanofluid stability and critical heat flux in pool boiling with nanocellulose’, Carbohydrate Polymers 213, pp. 393–402 [2] Kim, H., DeWitt, G., McKrell, T., Buongiorno, J., Hu, L.W., On the quenching of steel and zircaloy spheres in water-based nanofluids with alumina, silica and diamond nanoparticles, International Journal of Multiphase Flow 35, pp.427-438, 2009. [3] Bolukbasi, A., & Ciloglu, D. (2011). Pool boiling heat transfer characteristics of vertical cylinder quenched by SiO2–water nanofluids. International Journal of Thermal Sciences, 50(6), 1013-1021. [4] F.P. Incropera, D.P. DeWitt, Fundamentals of Heat and Mass Transfer, fourth. John Wiley and Sons, New York, 1996. [5] I.S. Kiyomura, L.L. Manetti, A.P. da Cunha, G. Ribastski, E.M. Cardoso, An analysis of the effects of nanoparticles deposition in characteristics of the heating surface and ON pool boiling of water, International Journal of Heat and Mass Transfer, 2016. [6] Kim, N.,J., Park S., S. & Ann, E., J. (2013). A study on the safety evaluation of nuclear reactor applying

  • nanofluids. Cheju National University.

[7] Zhang, Kai, et al. "Cellulose nanofibers: Fabrication and surface functionalization techniques." (2019). Transactions of the Korean Nuclear Society Virtual Spring Meeting July 9-10, 2020