
SLIDE 1
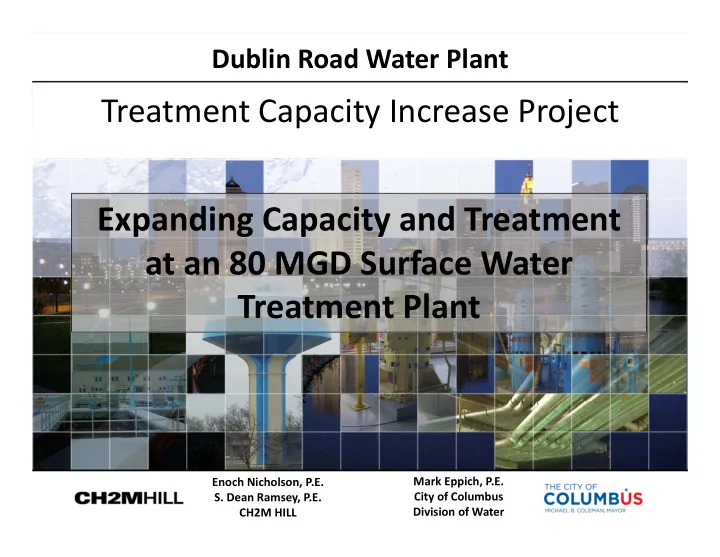
Dublin Road Water Plant
Treatment Capacity Increase Project
Mark Eppich, P.E. City of Columbus Division of Water Enoch Nicholson, P.E.
- S. Dean Ramsey, P.E.
CH2M HILL
Expanding Capacity and Treatment at an 80 MGD Surface Water Treatment - - PowerPoint PPT Presentation
Dublin Road Water Plant Treatment Capacity Increase Project Expanding Capacity and Treatment at an 80 MGD Surface Water Treatment Plant Mark Eppich, P.E. Enoch Nicholson, P.E. City of Columbus S. Dean Ramsey, P.E. Division of Water CH2M HILL
Mark Eppich, P.E. City of Columbus Division of Water Enoch Nicholson, P.E.
CH2M HILL
ALUM PAC ZN ORTHO-PHOSPHATE CO2 SODIUM HYPOCHLORITE POTASSIUM PERMANGANATE SODIUM HYDROXIDE SODA ASH LIME FLUORIDE Scioto River Rapid Mix Flocculator Turbidity Settling Rapid Mix Flocculator Softening Settling Re-carbonation Filters Clearwell
Residual R1 Residual R2 Residual R3 Residual R7
Turbidity Basins 1 & 2 Softening Basins 2 & 3
West East Residual R2
Dual Media Filters Recarbonation Basin 4
R3
– Target 80% of Location Running Annual Average (LRAA) and Operational Evaluation Level
7
11
12
13
14
15
0.0 0.5 1.0 1.5 2.0 2.5 3.0 Recarbonated Water (Pilot Influent) Ozonated Water BAC Filter (With Ozone) Antracite Filter (No Ozone)
16
Notes: *First DBP samples was collected late June 2011, no early June sample was available. Only Filters 4 and 6 were operational in June 2011. **No filter 2 DBP data available for June 2011, June 2011 Sample result predicted based on other sample results in order to calculated average.
17
10 20 30 40 50 60 70 80 6/22/2011* 9/9/2011 12/8/2011 3/8/2012 3‐day TTHM Formation (ug/L) Pilot DBP Sample Date Filter 6 Anth/Sand 3‐day TTHM (ug/L) Filter 2 BAC/Sand 3‐day TTHM (ug/L) Filter 6 Average 3‐day TTHM = 48 ug/L Filter 2 Average 3‐day TTHM = 32 ug/L**
0.000 0.050 0.100 0.150 0.200 0.250 0.300 5000 10000 15000 20000 25000 Filter 1 Ozonated GAC/Sand Filter 2 Ozonated BAC/Sand Filter 3 Ozonated Anthracite/Sand Filter 4 No Ozone GAC/Sand Filter 6 No Ozone Anthracite/Sand Turbidity (NTU) UFRV (gal/sf) Average UFRV Average Turb
18
IX
Low Ozone without Peroxide 22 15 32% Low Ozone with Peroxide 22 12 45% High Ozone without Peroxide 21 7.7 63% 22 6.9 68% High Ozone with Peroxide 22 0.4 98%
19
10 20 30 40 50 60 70 80 Alkalinity Concentration (mg/L as CaCO3)
DRWP IX Pilot Effluent Alkalinity
Minimum Average Maximum 50 100 150 200 250 300 350 Chloride Concentration (mg/L)
DRWP IX Pilot Effluent Chloride
Minimum Average Maximum 20 40 60 80 100 120 140 160 180 200 Sulfate Concentration (mg/L)
DRWP IX Pilot Effluent Sulfate
Minimum Average Maximum 1 2 3 4 5 6 7 8 9 10 Nitrate Concentration (mg/L as N)
DRWP IX Pilot Effluent Nitrate
Minimum Average Maximum
139 Nitrate Samples in 13 Runs 69 Sulfate Samples in 10 Runs 73 Alkalinity Samples in 10 Runs 69 Chloride Samples in 10 Runs
262.6 263.7 50 100 150 200 250 300 Bed Volumes
10.7 gpm/sq ft (2 min EBCT) 4.6 gpm/sq ft (5 min EBCT) 2.22 2.29 1 2 3 4 5 6 7 8 9 10 Nitrate as N (mg/L)
Data Includes 7 runs with 4.6 gpm/sq ft and 6 runs with 10.7 gpm/sq ft. These runs incorporated 93 and 46 samples, respectively.
ALUM PAC ZN ORTHO-PHOSPHATE CO2 SODIUM HYPOCHLORITE POTASSIUM PERMANGANATE SODIUM HYDROXIDE SODA ASH LIME FLUORIDE Scioto River Rapid Mix Flocculator Turbidity Settling Rapid Mix Flocculator Softening Settling Re-carbonation Clearwells
Residual R1 Residual R2 Residual R3 Residual R7
R1 R2 R6
Quarry Turbidity Basins 1 & 2 Softening Basins 3 & 4
West East
R4
Sludge Pump Station New Facilities New Facilities
New Recarbonation
NORMAL CHEMICAL ADDITION POINT Ion Exchange
New Ion Exchange Residual R2 Refit Basin 4 for Softening Residual R5
R3
Residual R4
Backwash Handling Facility
O3 New Ozone
GAC Filters Rehab Existing FILTER AID
Residual R6 5/15/2013
Filtration
R5
Residual R1
H2O2 OZONE QUENCH Ozonation Low Service Pumps Scioto River Intake High Service Pumps
CONTRACT # 1
CONTRACT # 2
CONTRACT # 3
CONTRACT # 4
CONTRACT # 4
Pipeline CONTRACT # 5