Every Student Succeeds Act Understanding MIP Calculations - - PDF document

every student succeeds act understanding mip calculations
SMART_READER_LITE
LIVE PREVIEW

Every Student Succeeds Act Understanding MIP Calculations - - PDF document

11/8/2018 Every Student Succeeds Act Understanding MIP Calculations Accountability Indicators Elementary/Middle High Schools Level Schools Both Composite Performance Composite Student Growth (also includes Social Performance (ELA,


slide-1
SLIDE 1

11/8/2018 1

Every Student Succeeds Act Understanding MIP Calculations

Accountability Indicators

Elementary/Middle Level Schools High Schools Both

Composite Performance (ELA, Math Science) Composite Performance (also includes Social Studies) Student Growth ELA/MATH Graduation Rates: 4th, 5th and 6th year cohorts Progress of ELL toward English Language Proficiency Academic Progress in ELA/MATH Chronic Absenteeism College, Career and Civic Readiness (CCCR)

slide-2
SLIDE 2

11/8/2018 2

Definitions of Accountability Indicators

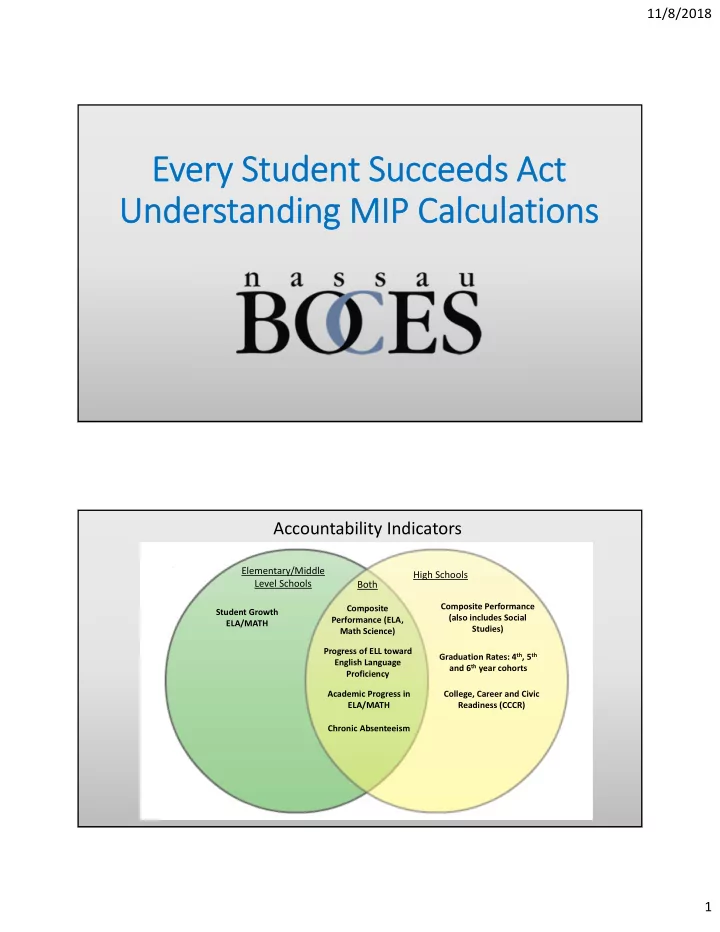
Performance Indicator Description Composite Performance

Measures achievement on state assessments in English language arts (ELA), mathematics, and science. For high schools, also measures achievement on state assessments in social studies

Student Growth

Measures student growth on statewide assessments in ELA and mathematics for students in grades 4‐8, by comparing the scores of students in the current year to the scores of students with similar scores in prior year(s).

Academic Progress

Measures progress on state assessments in ELA and in mathematics against long‐ term goals and Measures of Interim Progress (MIP).

Graduation Rates

Measures 4‐, 5‐, and 6‐year cohort graduation rates against long‐term goals and MIPs.

English Language Proficiency

Measures the progress of English Language Learners (ELL) in meeting their individual goals on the New York State English as a Second Language Achievement Test (NYSESLAT).

Chronic Absenteeism

Measures the percentage of students who miss 10% or more days of instruction against long‐term goals and MIPs.

College, Career and Civic Readiness (CCCR)

Measures the percentage of students who are leaving school prepared for college, career and civic readiness as measured by diplomas, credentials, advanced course credits and enrollment, career and technical education certifications, and other similar indicators against long‐term goals and MIPs.

= on current MIP REPORT

State Goals, State Measures of Interim Progress (MIPs), District/School MIPs

Goal or Interim Measure Description Example / Formula

“End Goal”

The desired level of performance that every subgroup in the State and in each district and school should ultimately attain. The end goal is used as a part of the process of determining how much of a gap exists between current and desired performance.

The “End Goal” for the “All Students” subgroup in ELA and Math is a PI of 200.

Baseline Performance

A group’s performance on a measure of student performance in the base year (i.e., the 2016‐17 school year for initial baselines).

State : The Baseline PI for NYS is 96.6 School: The Baseline PI of School “X” in District “Y” in 2016‐2017 is 100

Gap between “End Goal” and Current Performance

The achievement or graduation rate gap between a group’s “end” goal and baseline (i.e., current) performance.

State: The gap between the “End Goal” and the current PI is 103.4 points (200 – 96.6 = 103.4) School: The gap between the “End Goal” and the current PI is 100 points (200 – 100 = 100)

slide-3
SLIDE 3

11/8/2018 3

Understanding MIPs – Part 1

District BEDS District District/School Accountability Group Subgroup END GOAL 2016/2017 State Baseline State Long Term Goal State “Exceed” Long Term Goal 2017‐18 State MIP 2016‐17 School Baseline 2017‐2018 School MIP School Performance Matrix Level …ELA 3‐8, ALL STUDENTS 200 96.6 100

103.4 GAP 100 GAP

State Goals, State Measures of Interim Progress (MIPs), District/School MIPs

Goal or Interim Measure Description Example / Formula

20% of the Gap

The gap between the “end” goal and current performance multiplied by 0.20

State: 20% of the Gap between the “End Goal” and the State baseline is 20.7 (103.4 x .20 = 20.7) School: 20% of the gap between the “End Goal” and the current PI is 20 (100 x .20 = 20)

Long‐Term Goal (STATE)

The level of performance that each subgroup statewide and within a district and a school is expected to demonstrate five years from now. The long‐term goal is computed as a specified amount of reduction between the desired end goal and the statewide baseline performance. For example, the long‐term goal may be to reduce the achievement gap by 20%.

State: The Long‐Term goal is the State baseline + 20% of the gap. (96.6 + 20.7 = 117.3)

Yearly Gap Reduction Goal

Because New York State is working to close gaps by 20% in five years, the yearly gap reduction goal is the “20% of Gap” measure divided by 5.

State: The Yearly Gap Reduction Goal (STATE) is 4.1 points. (20.7 / 5 = 4.1) School: The Yearly Gap Reduction Goal (DISTRICT) is 4 points. (20 / 5 = 4)

NOTES: “END GOAL” = 200 State Baseline PI = 96.6 State Gap = 103.4 School Baseline PI = 100 School Gap = 100

slide-4
SLIDE 4

11/8/2018 4

Understanding MIPs – Part 2

District BEDS District District/School Accountability Group Subgroup END GOAL 2016/2017 State Baseline State Long Term Goal State “Exceed” Long Term Goal 2017‐18 State MIP 2016‐17 School Baseline 2017‐2018 School MIP School Performance Matrix Level …ELA 3‐8, ALL STUDENTS 200 96.6 117.3 100 Calculating State Long Term Goal 103.4 x .20 = 20.7 (20% Gap) 96.6 + 20.7 = 117.3

103.4 GAP

Understanding MIPs – Part 3

District BEDS District District/School Accountability Group Subgroup END GOAL 2016/2017 State Baseline State Long Term Goal State “Exceed” Long Term Goal 2017‐18 State MIP 2016‐17 School Baseline 2017‐2018 School MIP School Performance Matrix Level …ELA 3‐8, ALL STUDENTS 200 96.6 117.3 100.7 100 104 Calculate State MIPs (GAP is 20.7) [(200‐96.6) x .20] 20.7 / 5 = 4.14 (This is the Yearly GAP Reduction GOAL) 2017 – 2018 = 96.6 + 4.14 = 100.74 = 100.7 2018 – 2019 = 100.74 + 4.14 = 104.88 = 104.9 2019 – 2020 = 104.88 + 4.14 = 109.02 = 109.0 2020 – 2021 = 109.02 + 4.14 = 113.16 = 113.2 2021 – 2022 = 113.16 + 4.14 = 117.3 Calculate School MIPs (GAP is 20) [(200‐100) x .20] 20 / 5 = 4.0 (This is the Yearly GAP Reduction GOAL) 2017 – 2018 = 100 + 4.0 = 104 2018 – 2019 = 104 + 4.0 = 108 2019 – 2020 = 108 + 4.0 = 112 2020 – 2021 = 112 + 4.0 = 116 2021 – 2022 = 116 + 4.0 = 120

slide-5
SLIDE 5

11/8/2018 5

Goal or Interim Measure Description Example / Formula

First Annual Measure of Interim Progress (MIP)

Calculated by adding the yearly gap reduction goal to the “baseline performance” to determine an annual interim measure of progress, or target, for student performance.

State: The first MIP is equal to the State Baseline + the State Yearly Gap Reduction Goal 96.6 + 4.1 = 100.7 School: The first MIP is equal to the School Baseline + the School Yearly Gap Reduction Goal 100 + 4 = 104

Threshold “Exceeding the Long‐ Term Goal” (STATE)

The threshold to be classified as exceeding a subgroup’s long‐term goal; set as the long‐term goal plus 50% of the difference between the long‐term goal and the end goal. For example, if the end goal is a 95% 4‐year graduation rate and the long‐term goal is 89% for a group, exceeding the long‐term goal is performance at or above 92% for that group.

State: The threshold to “exceed” the Long‐Term State Goal is 158.7 Long Term Goal + .50( End Goal – Long Term Goal) 117.3 + .50 ( 200 – 117.3 ) = 158.7

State Goals, State Measures of Interim Progress (MIPs), District/School MIPs

NOTES: “END GOAL” = 200 State Baseline PI = 96.6 State Gap = 103.4 20% State Gap = 20.7 Long Term State = 117.3 Yearly Gap Reduction = 4.1 School Baseline PI = 100 School Gap = 100 20% School Gap = 20 Yearly Gap Reduction = 4

Understanding MIPs – Part 4

District BEDS District District/School Accountability Group Subgroup END GOAL 2016/2017 State Baseline State Long Term Goal State “Exceed” Long Term Goal 2017‐18 State MIP 2016‐17 School Baseline 2017‐2018 School MIP School Performance Matrix Level …ELA 3‐8, ALL STUDENTS 200 96.6 117.3 158.7 100.7 100 104 Calculating Threshold to “Exceed Long Term Goal” Long Term Goal + [.50(“End Goal” – Long Term Goal)] 117.3 + [.50(200 – 117.3)] 117.3 + [.50(82.7)] 117.3 + 41.35 158.65 ‐> 158.7

NOTES: “END GOAL” = 200 State Baseline PI = 96.6 State Gap = 103.4 20% State Gap = 20.7 Long Term State = 117.3 Yearly Gap Reduction = 4.1

slide-6
SLIDE 6

11/8/2018 6

Accountability Matrix

Did Not Meet Long‐Term Goal Met Long‐Term Goal Exceeded Long‐Term Goal Did not meet either MIP Level 1 N/A N/A Met lower of State or School MIP Level 2 Level 3 Level 4 Met higher of State

  • r School MIP

Level 3 Level 4 Level 4

Understanding MIPs – Scenario #1 ‐ ELA LEVEL 1

District BEDS District District/School Accountability Group Subgroup END GOAL 2016/2017 State Baseline State Long Term Goal State “Exceed” Long Term Goal 2017‐18 State MIP 2016‐17 School Baseline 2017‐2018 School MIP School Performance (PI) Matrix Level …ELA 3‐8, ALL STUDENTS 200 96.6 117.3 158.7 100.7 100 104 99.8 Level 1 Level 1 Rating: The PI was less than the 2017 ‐ 2018 School MIP The PI was less than the 2017 ‐ 2018 State MIP Did not meet either MIP The PI did not meet the Long‐Term Goal The PI did not “Exceed” the Long‐Term Goal Did not Meet Long‐Term Goal

Did Not Meet Long‐Term Goal Met Long‐Term Goal Exceeded Long‐ Term Goal Did not meet either MIP Level 1 N/A N/A Met lower of State

  • r School MIP

Level 2 Level 3 Level 4 Met higher of State

  • r School MIP

Level 3 Level 4 Level 4

slide-7
SLIDE 7

11/8/2018 7

Understanding MIPs – Scenario #2 ‐ ELA LEVEL 2

District BEDS District District/School Accountability Group Subgroup END GOAL 2016/2017 State Baseline State Long Term Goal State “Exceed” Long Term Goal 2017‐18 State MIP 2016‐17 School Baseline 2017‐2018 School MIP School Performance (PI) Matrix Level …ELA 3‐8, ALL STUDENTS 200 96.6 117.3 158.7 100.7 100 104 102 Level 2 Level 2 Rating: The PI was less than the 2017 ‐ 2018 School MIP The PI was greater than the 2017 ‐ 2018 State MIP Met lower of State or School MIP The PI did not meet the Long‐Term Goal The PI did not “Exceed” the Long‐Term Goal Did not Meet Long‐Term Goal

Did Not Meet Long‐Term Goal Met Long‐Term Goal Exceeded Long‐ Term Goal Did not meet either MIP Level 1 N/A N/A Met lower of State

  • r School MIP

Level 2 Level 3 Level 4 Met higher of State

  • r School MIP

Level 3 Level 4 Level 4

Understanding MIPs – Scenario #3 ‐ ELA LEVEL 3

District BEDS District District/School Accountability Group Subgroup END GOAL 2016/2017 State Baseline State Long Term Goal State “Exceed” Long Term Goal 2017‐18 State MIP 2016‐17 School Baseline 2017‐2018 School MIP School Performance (PI) Matrix Level …ELA 3‐8, ALL STUDENTS 200 96.6 117.3 158.7 100.7 100 104 105 Level 3 Level 3 Rating: The PI was greater than the 2017 ‐ 2018 School MIP The PI was greater than the 2017 ‐ 2018 State MIP Met higher of State or School MIP The PI did not meet the Long‐Term Goal The PI did not “Exceed” the Long‐Term Goal Did not Meet Long‐Term Goal

Did Not Meet Long‐Term Goal Met Long‐Term Goal Exceeded Long‐ Term Goal Did not meet either MIP Level 1 N/A N/A Met lower of State

  • r School MIP

Level 2 Level 3 Level 4 Met higher of State

  • r School MIP

Level 3 Level 4 Level 4

slide-8
SLIDE 8

11/8/2018 8

Understanding MIPs – Scenario #4 ‐ ELA LEVEL 3

District BEDS District District/School Accountability Group Subgroup END GOAL 2016/2017 State Baseline State Long Term Goal State “Exceed” Long Term Goal 2017‐18 State MIP 2016‐17 School Baseline 2017‐2018 School MIP School Performance (PI) Matrix Level …ELA 3‐8, ALL STUDENTS 200 96.6 117.3 158.7 100.7 120 124.8 122 Level 3 Level 3 Rating: The PI was less than the 2017 ‐ 2018 School MIP The PI was greater than the 2017 ‐ 2018 State MIP Met lower of State or School MIP The PI did meet the Long‐Term Goal The PI did not “Exceed” the Long‐Term Goal Met Long‐Term Goal

Did Not Meet Long‐Term Goal Met Long‐Term Goal Exceeded Long‐ Term Goal Did not meet either MIP Level 1 N/A N/A Met lower of State

  • r School MIP

Level 2 Level 3 Level 4 Met higher of State

  • r School MIP

Level 3 Level 4 Level 4

Understanding MIPs – Scenario #5 ‐ ELA LEVEL 4

District BEDS District District/School Accountability Group Subgroup END GOAL 2016/2017 State Baseline State Long Term Goal State “Exceed” Long Term Goal 2017‐18 State MIP 2016‐17 School Baseline 2017‐2018 School MIP School Performance (PI) Matrix Level …ELA 3‐8, ALL STUDENTS 200 96.6 117.3 158.7 100.7 120 124.8 127 Level 4 Level 4 Rating: The PI was greater than the 2017 ‐ 2018 School MIP The PI was greater than the 2017 ‐ 2018 State MIP Met higher of State or School MIP The PI did meet the Long‐Term Goal The PI did not “Exceed” the Long‐Term Goal Met Long‐Term Goal

Did Not Meet Long‐Term Goal Met Long‐Term Goal Exceeded Long‐ Term Goal Did not meet either MIP Level 1 N/A N/A Met lower of State

  • r School MIP

Level 2 Level 3 Level 4 Met higher of State

  • r School MIP

Level 3 Level 4 Level 4

slide-9
SLIDE 9

11/8/2018 9

Understanding MIPs – Scenario #6 ‐ ELA LEVEL 4

District BEDS District District/School Accountability Group Subgroup END GOAL 2016/2017 State Baseline State Long Term Goal State “Exceed” Long Term Goal 2017‐18 State MIP 2016‐17 School Baseline 2017‐2018 School MIP School Performance (PI) Matrix Level …ELA 3‐8, ALL STUDENTS 200 96.6 117.3 158.7 100.7 120 124.8 160 Level 4 Level 4 Rating: The PI was greater than the 2017 ‐ 2018 School MIP The PI was greater than the 2017 ‐ 2018 State MIP Met higher of State or School MIP The PI did meet the Long‐Term Goal The PI did “Exceed” the Long‐Term Goal Exceeded Long‐Term Goal

Did Not Meet Long‐Term Goal Met Long‐Term Goal Exceeded Long‐ Term Goal Did not meet either MIP Level 1 N/A N/A Met lower of State

  • r School MIP

Level 2 Level 3 Level 4 Met higher of State

  • r School MIP

Level 3 Level 4 Level 4

Understanding MIPs – Scenario #7 ‐ ELA LEVEL 4

District BEDS District District/School Accountability Group Subgroup END GOAL 2016/2017 State Baseline State Long Term Goal State “Exceed” Long Term Goal 2017‐18 State MIP 2016‐17 School Baseline 2017‐2018 School MIP School Performance (PI) Matrix Level …ELA 3‐8, ALL STUDENTS 200 96.6 117.3 158.7 100.7 160 161.6 160.3 Level 4 Level 4 Rating: The PI was less than the 2017 ‐ 2018 School MIP The PI was greater than the 2017 ‐ 2018 State MIP Met lower of State or School MIP The PI did meet the Long‐Term Goal The PI did “Exceed” the Long‐Term Goal Exceeded Long‐Term Goal

Did Not Meet Long‐Term Goal Met Long‐Term Goal Exceeded Long‐ Term Goal Did not meet either MIP Level 1 N/A N/A Met lower of State

  • r School MIP

Level 2 Level 3 Level 4 Met higher of State

  • r School MIP

Level 3 Level 4 Level 4

slide-10
SLIDE 10

11/8/2018 10

District BEDS District District/School Accountability Group Subgroup END GOAL 2016/2017 State Baseline State Long Term Goal State “Exceed” Long Term Goal 2017‐18 State MIP 2016‐17 School Baseline 2017‐2018 School MIP School Performance (%) Matrix Level …CA (HS), ALL STUDENTS 5 24.2 20.4 12.7 23.4 22.2 21.5 24.8 Level 1 Level 1 Rating: The PI was greater than the 2017 ‐ 2018 School MIP The PI was greater than the 2017 ‐ 2018 State MIP Did not meet either MIP The PI did not meet the Long‐Term Goal The PI did not “Exceed” the Long‐Term Goal Did not Meet Long‐Term Goal

Understanding MIPs – Scenario #8 Chronic Absenteeism (Inverse) – Level 1

Did Not Meet Long‐Term Goal Met Long‐Term Goal Exceeded Long‐ Term Goal Did not meet either MIP Level 1 N/A N/A Met lower of State

  • r School MIP

Level 2 Level 3 Level 4 Met higher of State

  • r School MIP

Level 3 Level 4 Level 4

District BEDS District District/School Accountability Group Subgroup END GOAL 2016/2017 State Baseline State Long Term Goal State “Exceed” Long Term Goal 2017‐18 State MIP 2016‐17 School Baseline 2017‐2018 School MIP School Performance (%) Matrix Level …CA (HS), ALL STUDENTS 5 24.2 20.4 12.7 23.4 22.2 21.5 22.9 Level 2 Level 2 Rating: The PI was greater than the 2017 ‐ 2018 School MIP The PI was less than the 2017 ‐ 2018 State MIP Met lower of State or School MIP The PI did not meet the Long‐Term Goal The PI did not “Exceed” the Long‐Term Goal Did not Meet Long‐Term Goal

Understanding MIPs – Scenario #9 Chronic Absenteeism (Inverse) – Level 2

Did Not Meet Long‐Term Goal Met Long‐Term Goal Exceeded Long‐ Term Goal Did not meet either MIP Level 1 N/A N/A Met lower of State

  • r School MIP

Level 2 Level 3 Level 4 Met higher of State

  • r School MIP

Level 3 Level 4 Level 4

slide-11
SLIDE 11

11/8/2018 11

District BEDS District District/School Accountability Group Subgroup END GOAL 2016/2017 State Baseline State Long Term Goal State “Exceed” Long Term Goal 2017‐18 State MIP 2016‐17 School Baseline 2017‐2018 School MIP School Performance (%) Matrix Level …CA (HS), ALL STUDENTS 5 24.2 20.4 12.7 23.4 22.2 21.5 20.9 Level 3 Level 3 Rating: The PI was less than the 2017 ‐ 2018 School MIP The PI was less than the 2017 ‐ 2018 State MIP Met higher of State or School MIP The PI did not meet the Long‐Term Goal The PI did not “Exceed” the Long‐Term Goal Did not Meet Long‐Term Goal

Understanding MIPs – Scenario #10 Chronic Absenteeism (Inverse) – Level 3

Did Not Meet Long‐Term Goal Met Long‐Term Goal Exceeded Long‐ Term Goal Did not meet either MIP Level 1 N/A N/A Met lower of State

  • r School MIP

Level 2 Level 3 Level 4 Met higher of State

  • r School MIP

Level 3 Level 4 Level 4

District BEDS District District/School Accountability Group Subgroup END GOAL 2016/2017 State Baseline State Long Term Goal State “Exceed” Long Term Goal 2017‐18 State MIP 2016‐17 School Baseline 2017‐2018 School MIP School Performance (%) Matrix Level …CA (HS), ALL STUDENTS 5 24.2 20.4 12.7 23.4 18.4 17.9 18.2 Level 3 Level 3 Rating: The PI was greater than the 2017 ‐ 2018 School MIP The PI was less than the 2017 ‐ 2018 State MIP Met lower of State or School MIP The PI did meet the Long‐Term Goal The PI did not “Exceed” the Long‐Term Goal Met Long‐Term Goal

Understanding MIPs – Scenario #11 Chronic Absenteeism (Inverse) – Level 3

Did Not Meet Long‐Term Goal Met Long‐Term Goal Exceeded Long‐ Term Goal Did not meet either MIP Level 1 N/A N/A Met lower of State

  • r School MIP

Level 2 Level 3 Level 4 Met higher of State

  • r School MIP

Level 3 Level 4 Level 4

slide-12
SLIDE 12

11/8/2018 12

District BEDS District District/School Accountability Group Subgroup END GOAL 2016/2017 State Baseline State Long Term Goal State “Exceed” Long Term Goal 2017‐18 State MIP 2016‐17 School Baseline 2017‐2018 School MIP School Performance (%) Matrix Level …CA (HS), ALL STUDENTS 5 24.2 20.4 12.7 23.4 18.4 17.9 17.3 Level 4 Level 4 Rating: The PI was less than the 2017 ‐ 2018 School MIP The PI was less than the 2017 ‐ 2018 State MIP Met higher of State or School MIP The PI did meet the Long‐Term Goal The PI did not “Exceed” the Long‐Term Goal Met Long‐Term Goal

Understanding MIPs – Scenario #12 Chronic Absenteeism (Inverse) – Level 4

Did Not Meet Long‐Term Goal Met Long‐Term Goal Exceeded Long‐ Term Goal Did not meet either MIP Level 1 N/A N/A Met lower of State

  • r School MIP

Level 2 Level 3 Level 4 Met higher of State

  • r School MIP

Level 3 Level 4 Level 4

District BEDS District District/School Accountability Group Subgroup END GOAL 2016/2017 State Baseline State Long Term Goal State “Exceed” Long Term Goal 2017‐18 State MIP 2016‐17 School Baseline 2017‐2018 School MIP School Performance (%) Matrix Level …CA (HS), ALL STUDENTS 5 24.2 20.4 12.7 23.4 18.4 17.9 11.3 Level 4 Level 4 Rating: The PI was less than the 2017 ‐ 2018 School MIP The PI was less than the 2017 ‐ 2018 State MIP Met higher of State or School MIP The PI did meet the Long‐Term Goal The PI did “Exceed” the Long‐Term Goal Exceeded Long‐Term Goal

Understanding MIPs – Scenario #13 Chronic Absenteeism (Inverse) – Level 4

Did Not Meet Long‐Term Goal Met Long‐Term Goal Exceeded Long‐ Term Goal Did not meet either MIP Level 1 N/A N/A Met lower of State

  • r School MIP

Level 2 Level 3 Level 4 Met higher of State

  • r School MIP

Level 3 Level 4 Level 4

slide-13
SLIDE 13

11/8/2018 13

District BEDS District District/School Accountability Group Subgroup END GOAL 2016/2017 State Baseline State Long Term Goal State “Exceed” Long Term Goal 2017‐18 State MIP 2016‐17 School Baseline 2017‐2018 School MIP School Performance (%) Matrix Level …CA (HS), ALL STUDENTS 5 24.2 20.4 12.7 23.4 10.0 9.8 9.9 Level 4 Level 4 Rating: The PI was higher than the 2017 ‐ 2018 School MIP The PI was less than the 2017 ‐ 2018 State MIP Met lower of State or School MIP The PI did meet the Long‐Term Goal The PI did “Exceed” the Long‐Term Goal Exceeded Long‐Term Goal

Understanding MIPs – Scenario #14 Chronic Absenteeism (Inverse) – Level 4

Did Not Meet Long‐Term Goal Met Long‐Term Goal Exceeded Long‐ Term Goal Did not meet either MIP Level 1 N/A N/A Met lower of State

  • r School MIP

Level 2 Level 3 Level 4 Met higher of State

  • r School MIP

Level 3 Level 4 Level 4

Elementary / Middle Indicators

Elementary/Middle Indicators

Subgroup Composite Performance Growth Composite Performance & Growth Combined English Language Proficiency (ELP) Progress Chronic Absenteeism All Students Level # Level # Level # Level # Level # Level # American Indian / Alaska Native Level # Level # Level # Level # Level # Level # Asian or Native Hawaiian / Other Pacific Islander Level # Level # Level # Level # Level # Level # Black or African American Level # Level # Level # Level # Level # Level # Hispanic or Latino Level # Level # Level # Level # Level # Level # Multiracial Level # Level # Level # Level # Level # Level # White Level # Level # Level # Level # Level # Level # English Language Learner Level # Level # Level # Level # Level # Level # Students with Disabilities Level # Level # Level # Level # Level # Level # Economically Disadvantaged Level # Level # Level # Level # Level # Level #

slide-14
SLIDE 14

11/8/2018 14

High School Indicators

High School Indicators

Subgroup Composite Performance Graduation Rate Composite Performance & Graduation Combined English Language Proficiency (ELP) Progress Chronic Absenteeism College, Career & Civic Readiness (CCCR) All Students Level # Level # Level # Level # Level # Level # Level # American Indian / Alaska Native Level # Level # Level # Level # Level # Level # Level # Asian or Native Hawaiian / Other Pacific Islander Level # Level # Level # Level # Level # Level # Level # Black or African American Level # Level # Level # Level # Level # Level # Level # Hispanic or Latino Level # Level # Level # Level # Level # Level # Level # Multiracial Level # Level # Level # Level # Level # Level # Level # White Level # Level # Level # Level # Level # Level # Level # English Language Learner Level # Level # Level # Level # Level # Level # Level # Students with Disabilities Level # Level # Level # Level # Level # Level # Level # Economically Disadvantaged Level # Level # Level # Level # Level # Level # Level #