
SLIDE 1
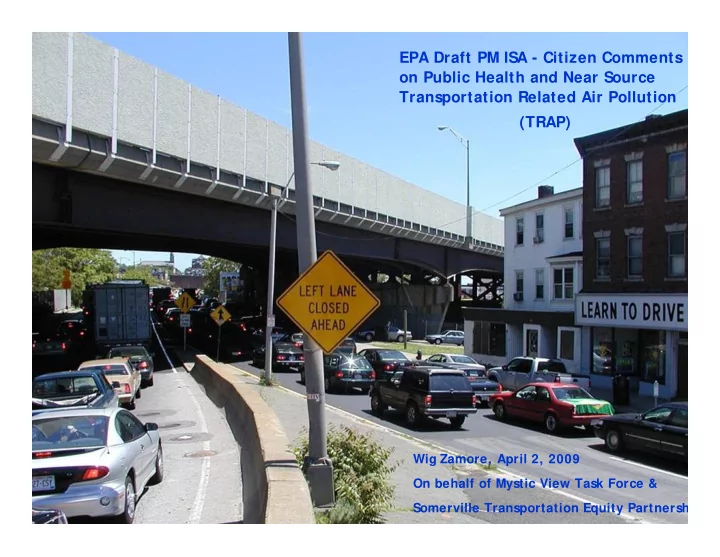
Wig Zamore, April 2, 2009 On behalf of Mystic View Task Force & Somerville Transportation Equity Partnersh
EPA Draft PM ISA - Citizen Comments
- n Public Health and Near Source
Transportation Related Air Pollution (TRAP)