
SLIDE 1
1
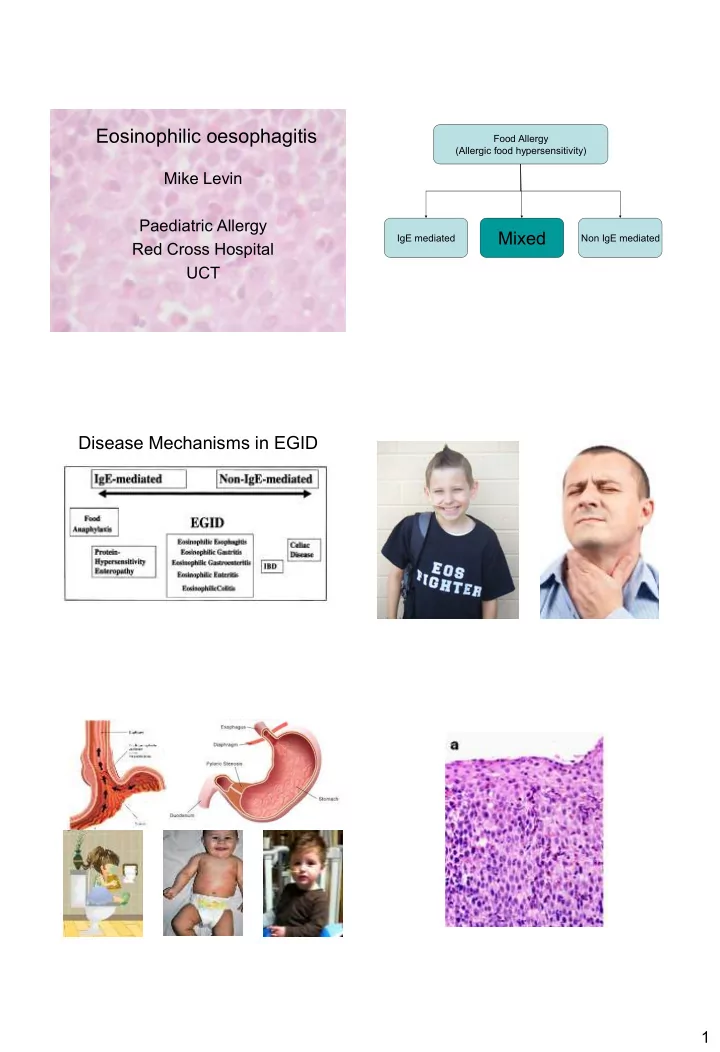
Eosinophilic oesophagitis
Mike Levin Paediatric Allergy Red Cross Hospital UCT
Food Allergy (Allergic food hypersensitivity) IgE mediated
Mixed
Non IgE mediated
Disease Mechanisms in EGID
Rothenberg, JACI, 2004
Eosinophilic oesophagitis Food Allergy (Allergic food - - PDF document
Eosinophilic oesophagitis Food Allergy (Allergic food hypersensitivity) Mike Levin Paediatric Allergy Mixed IgE mediated Non IgE mediated Red Cross Hospital UCT Disease Mechanisms in EGID Rothenberg, JACI, 2004 1 Children with Higher
Rothenberg, JACI, 2004
1 2 3 4 5
S1 1 2 3 4 5 6
Reflux Index
Normal Histology (n=171) No eos Histologic Changes (n=40) 1-5 Eos/hpf (n=42) 6-20 Eos/hpf (n=21) >20 Eos/hpf (n=31)
Ruchelli et al, Ped Dev Path, 1998 Normal Concentric Rings, Narrowing Fox, et al, Gastrointestinal Endoscopy, 2003
Fox, et al, Gastrointestinal Endoscopy, 2003
Normal Concentric Rings Pallor, Lichenification Linear Furrowing Pallor, White Plaques
Rothenberg JACI 2004
Characteristic EE GORD Atopic diatheses High (70%) Normal Food Sensitization High Normal Sex Predilection Male (70%) None Abdominal Pain Common Common Food Impaction Common Uncommon pH Probe Negative Positive Endoscopic furrowing Often Uncommon Diffuse Eosinophilia Yes No Basal Zone Hyperplasia Yes (Severe) Yes Number of Eosinophils >15/hpf at 40x <7/hpf at 40x Acid Blockade Partial alleviation Alleviation Antigen Elimination Sometimes alleviates No alleviation
IL - 5 Eotaxin 3 Periostin
Gastroenterology 2013 145(6):1289-99
Non erosive reflux disease
Gastroenterology 2013 145(6):1289-99
Allergy Asthma Proc 2012;33:519-524
Gut 2013; 62 (10):1395-1405 ON BIOPSY
Normal Achalasia Reflux Reflux EoE Normal Achalasia Reflux Reflux EoE Normal Achalasia Reflux Reflux EoE
worse distally Consistent level
impedance
Normal EoE with focal stricture EoE with narrow calibre EoE with normal endoscopy
Therap Adv Gastro 2013; 6(2): 97-107
Vomiting Abdominal Pain Dysphagia Esophageal Stricture Age 50% 50% 30% (Pediatric) 97% (Adults) 10% (Pediatric) 37% (Adult) Food Impaction 13% (Pediatric) 51% (Adult) Feeding Disorder 13% ??
META-ANALYSIS
Gastroenterol 2002
Spergel et al, JACI 2007 Food SPT APT PPV NPV Specificity Sensitivity PPV NPV Specificity Sensitivity Milk 95.7% 57.7% 42.3% 97.6% 83.3% 58.7% 43.5% 90.2% Egg 84.8% 75.4% 65.1% 90.2% 78.3% 82.8% 62.1% 91.4% Soy 70.0% 68.9% 37.8% 89.5% 66.7% 87.3% 66.7% 87.3% Wheat 77.8% 64.7% 18.9% 96.5% 74.2% 83.9% 71.9% 85.5% Corn 57.1% 71.3% 13.8% 95.4% 65.8% 93.9% 89.3% 78.0% Beef 81.8% 74.7% 30.0% 96.9% 94.4% 87.0% 65.4% 98.4% Chicken 50.0% 83.3% 26.3% 93.3% 66.7% 95.7% 80.0% 91.7% Rice 50.0% 85.6% 13.3% 97.5% 59.1% 96.9% 86.7% 87.5% Potato 60.0% 89.9% 25.0% 97.6% 53.8% 94.6% 63.6% 92.1% Peanut 77.8% 97.6% 77.8% 97.6% 75.0% 97.6% 60.0% 98.8%
Gastroenterol 2002
2014 META-ANALYSIS
Immunol 2005
Gastro Hep 2006
Milk, Wheat/gluten, Eggs, Soy, Peanuts/tree nuts, Fish/shellfish
Gastroenterology 2014 META-ANALYSIS
JACI 2014
Milk, Wheat, Eggs, legumes
2015
Empiric 4 Elimination Diet 71% Arias
Gastroenterology 2014 META-ANALYSIS
Liacouras et al Oral steroids 100%
Liacouras et al Oral steroids 100% Teitelbaum et al Gastroenterol 2002 Topical Fluticasone Open label, Pediatric 85% Remedios et al Gastroint Endos 2006 Topical Fluticasone Open label, Adult 95% Konikoff et al Gastroenterol 2006 Topical Fluticasone Randomized, Controlled 50% Aceves et al Am J Gastro 2007 Topical Budesonide Retrospective 80%
Typical symptoms AND eosinophil count of > 15 /hpf
Typical symptoms AND some eosinophils <15/hpf AND minor features AND response to EE therapy, not GORD therapy
Typical symptoms AND some eosinophils <15/hpf OR minor features AND uncertain / no response to therapy
Medical treatment (for 2-3 months) Alternative dietary strategy
“Steady state” achieved with acceptable symptoms and acceptable diet
0 1 2 3 4 5 6 7 8 9 10