
SLIDE 1
Engulfing Patterns
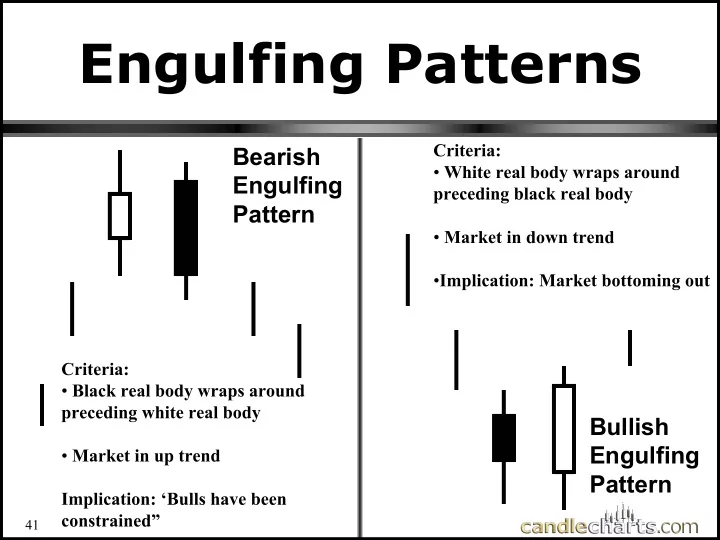
Bearish Bearish Engulfing Engulfing Pattern Pattern Bullish Bullish Engulfing Engulfing Pattern Pattern
Criteria:
- Black real body wraps around
preceding white real body
- Market in up trend
Implication: ‘Bulls have been constrained” Criteria:
- White real body wraps around
preceding black real body
- Market in down trend
- Implication: Market bottoming out
41