SLIDE 12 Infraday 2007, Berlin F.Wirl, University of Vienna, Y.Yegorov, IHS, Vienna 12
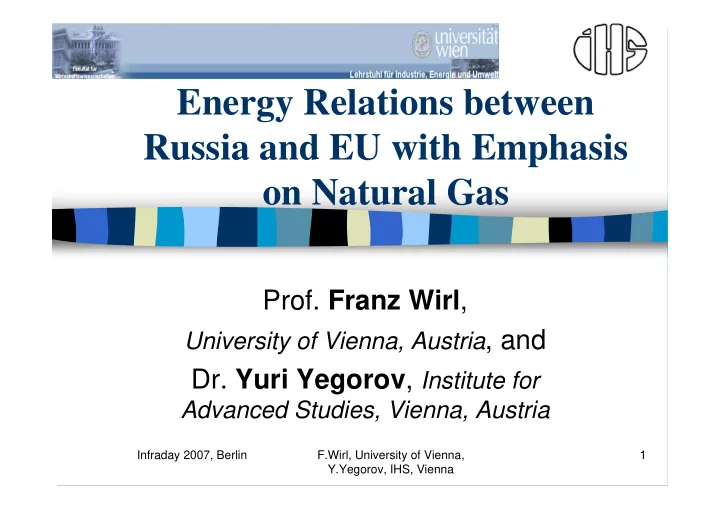
N Country Reserve % R/P years Production mtoe YUS Cons. 2005 Export mtoe Export% 1 Russia 47,82 26,6 80 538,2 75,52 364,6 173,6 32,3 2 Iran 26,74 14,9 >100 78,3 42,23 79,6
3 Qatar 25,78 14,3 >100 39,2 40,72 14,3 24,9 63,5 4 Saudi Arabia 6,9 3,8 99 62,6 10,87 62,6 0,0 5 OAE 6,04 3,4 >100 41,9 9,54 36,4 5,5 13,1 6 USA 5,45 3 10,4 473 8,63 570,1
7 Nigeria 5,23 2,9 >100 19,6 8,26 n/a n/a n/a 8 Algeria 4,58 2,5 52,2 79 7,23 21,7 57,3 72,5 9 Venezuela 4,32 2,4 >100 26,1 6,82 26,1 0,0 10 Iraq 3,17 1,8 >100 n/a 5,01 n/a n/a n/a 11 Kazakhstan 3 1,7 >100 21,1 4,74 16 5,1 24,2 12 Indonesia 2,76 1,5 36,3 68,4 4,36 35,5 32,9 48,1 13 Australia 2,52 1,4 67,9 33,4 3,98 23,1 10,3 30,8 14 Malaysia 2,48 1,4 41,4 54 3,92 31,4 22,6 41,9 15 Norway 2,41 1,3 28,3 76,5 3,80 4 72,5 94,8 16 China 2,35 1,3 47 45 3,71 42,3 2,7 6,0
Table 1. The main world gas reserves holders, their production and consumption. Source: BP data [1] and calculations by authors.