SLIDE 1
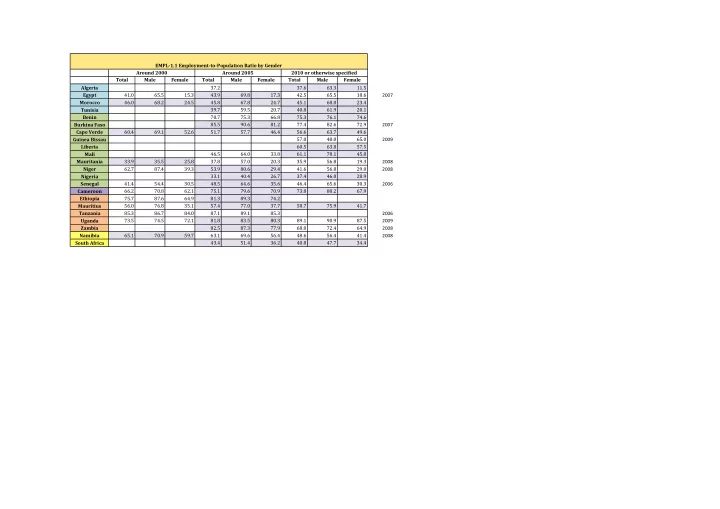
Total Male Female Total Male Female Total Male Female Algeria 37.2 37.6 63.3 11.5 Egypt 41.0 65.5 15.3 43.9 69.8 17.3 42.5 65.5 18.6 2007 Morocco 46.0 68.2 24.5 45.8 67.8 24.7 45.1 68.0 23.4 Tunisia 39.7 59.5 20.7 40.8 61.9 20.1 Benin 70.7 75.3 66.8 75.3 76.1 74.6 Burkina Faso 85.5 90.6 81.2 77.4 82.6 72.9 2007 Cape Verde 60.4 69.1 52.6 51.7 57.7 46.4 56.6 63.7 49.6 Guinea Bissau 57.0 48.0 65.0 2009 Liberia 60.5 63.8 57.5 Mali 46.5 64.0 33.8 61.1 78.1 45.8 Mauritania 33.9 35.5 25.8 37.8 57.0 20.3 35.9 56.8 19.3 2008 Niger 62.7 87.4 39.3 53.9 80.6 29.4 41.6 56.8 29.0 2008 Nigeria 33.1 40.4 26.7 37.4 46.0 28.9 Senegal 41.4 54.4 30.5 48.5 64.6 35.6 46.4 65.6 30.3 2006 Cameroon 66.2 70.8 62.1 75.1 79.6 70.9 73.8 80.2 67.9 Ethiopia 75.7 87.6 64.9 81.3 89.3 74.2 Mauritius 56.0 76.8 35.1 57.4 77.0 37.7 58.7 75.9 41.7 Tanzania 85.3 86.7 84.0 87.1 89.1 85.3 2006 Uganda 73.5 74.5 72.1 81.8 83.5 80.3 89.1 90.9 87.5 2009 Zambia 82.5 87.3 77.9 68.0 72.4 64.9 2008 Namibia 65.1 70.9 59.7 63.1 69.6 56.4 48.6 56.4 41.4 2008 South Africa 43.4 51.4 36.2 40.8 47.7 34.4 EMPL-1.1 Employment-to-Population Ratio by Gender Around 2000 Around 2005 2010 or otherwise specified
SLIDE 2
Total Male Female Total Male Female Total Male Female Algeria 27.3 26.6 31.4 15.3 14.9 17.5 10.0 8.1 19.1 Egypt 11.0 7.1 24.3 8.9 4.8 22.8 Morocco 13.9 14.2 13.1 11.5 11.4 11.6 9.4 9.2 9.8 Tunisia 14.2 9.0 17.3 13.0 10.9 18.9 Benin 2.1 1.7 2.6 0.9 0.8 1.0 Burkina Faso 4.0 2.7 5.3 11.4 8.2 14.2 2007 Cape Verde 8.6 6.7 10.9 21.4 20.9 22.0 10.7 9.6 12.0 Guinea Bissau 8.0 11.0 6.0 2009 Liberia 3.7 3.4 4.1 Mali 9.0 7.4 11.1 8.3 6.2 11.4 Mauritania 19.1 15.3 27.4 32.5 24.8 46.9 31.2 23.9 44.0 2008 Niger 3.1 3.4 2.7 2.4 4.6 0.5 2008 Nigeria 11.9 11.6 12.3 21.4 19.6 23.5 Senegal 14.1 13.2 15.0 10.2 8.2 13.8 2006 Cameroon 7.9 8.7 7.0 5.1 4.9 5.3 4.3 3.5 5.1 Ethiopia 8.4 4.5 12.7 7.7 2.8 8.4 Mauritius 9.3 8.2 11.8 9.7 5.9 16.6 7.9 4.7 13.1 Tanzania 5.0 4.2 5.8 4.7 3.0 6.2 2006 Uganda 0.9 1.2 0.4 2.0 1.7 2.2 4.2 3.6 4.5 2009 Zambia 2.4 2.0 2.9 7.9 8.1 7.7 2008 Namibia 20.6 21.2 20.1 21.6 19.5 25.2 37.8 32.8 43.3 2008 South Africa 23.8 20.0 28.2 24.9 22.8 27.5 EMPL-2.1 Unemployment Rate by Gender Around 2000 Around 2005 2010 or otherwise specified
SLIDE 3
Total Male Female Total Male Female Total Male Female Algeria ... ... ... Egypt ... ... ... Morocco 36.2 17.2 55.4 35.7 17.4 53.7 31.4 12.5 50.6 Tunisia ... ... ... Benin 8.8 7.1 10.3 3.9 2.9 5.1 Burkina Faso 9.7 4.5 14.3 17.2 11.0 22.3 2007 Cape Verde 26.3 20.9 31.5 31.7 28.2 35.1 36.0 33.2 38.9 Guinea Bissau 20.0 23.0 18.0 2009 Liberia ... ... ... Mali 21.8 12.3 28.9 11.1 7.8 13.9 Mauritania 45.6 32.4 57.5 44.4 28.2 57.6 2008 Niger 23.1 12.1 42.0 45.2 38.3 53.5 2008 Nigeria 30.7 28.7 31.3 12.2 11.9 12.0 Senegal 52.0 36.6 65.3 43.2 23.8 60.1 2006 Cameroon 17.9 13.0 22.4 10.1 6.4 13.5 10.8 4.7 16.0 Ethiopia ... ... ... Mauritius 32.1 21.0 43.6 26.4 15.9 37.4 19.8 14.2 25.7 Tanzania 12.1 10.4 13.8 9.0 6.7 11.1 2006 Uganda 15.7 11.5 20.0 8.3 4.7 11.5 7.3 4.1 9.9 2009 Zambia 13.3 12.9 13.9 9.6 5.2 13.7 15.5 11.9 19.0 2008 Namibia ... ... ... South Africa 38.6 33.5 43.2 40.0 36.3 43.4 EMPL-3.1 Youth Not in Education Not in Employment, 15-24 years, by Gender Around 2000 Around 2005 2010 or otherwise specified
SLIDE 4
Total Male Female Total Male Female Total Male Female Algeria 47.8 31.1 21.5 18.6 37.4 Egypt 27.7 19.2 51.1 34.1 23.3 62.2 24.8 17.2 47.9 2007 Morocco 19.6 21.1 15.8 17.0 17.8 14.9 17.6 18.1 16.1 Tunisia 30.7 31.4 29.3 29.4 Benin 3.8 3.0 4.4 2.0 1.4 2.5 Burkina Faso 6.4 4.5 8.2 16.4 13.7 18.6 2007 Cape Verde 17.2 13.9 21.3 38.5 34.2 43.9 21.6 18.7 25.6 Guinea Bissau 6.0 7.0 5.0 2009 Liberia 6.1 4.0 8.0 Mali 12.6 12.0 13.2 10.9 7.8 14.5 Mauritania 64.5 57.9 73.5 53.2 44.1 66.7 2008 Niger 4.5 5.5 3.7 2.3 4.4 0.8 2008 Nigeria 34.2 33.7 32.7 25.2 25.9 26.0 Senegal 19.1 16.8 22.1 14.8 11.9 20.1 2006 Cameroon 14.4 16.4 12.5 7.6 7.3 7.9 6.4 5.3 7.5 Ethiopia 11.0 6.1 16.1 7.4 3.9 10.7 Mauritius 27.7 26.6 29.8 26.0 20.6 34.4 23.5 19.2 29.4 Tanzania 8.9 8.0 9.8 8.8 7.4 10.1 2006 Uganda 1.4 1.8 0.7 3.1 2.5 3.6 3.8 3.3 4.2 2009 Zambia 10.2 13.1 7.5 4.4 4.2 4.7 14.0 14.9 13.1 2008 Namibia 42.0 40.0 44.0 41.6 36.5 47.1 58.9 54.5 63.7 2008 South Africa 46.7 41.5 52.3 50.5 47.2 54.6 EMPL-6.1 Youth Unemployment Rate, 15-24 years, by Gender 2010 or otherwise specified Around 2005 Around 2000
SLIDE 5
Total Male Female Total Male Female Total Male Female Algeria ... ... ... Egypt ... ... ... Morocco 39.0 43.0 23.8 37.3 40.9 21.7 2007 Tunisia ... ... ... Benin 95.3 93.4 97.3 98.2 97.2 99.2 Burkina Faso ... ... ... Cape Verde 54.7 55.3 54.0 2009 Guinea Bissau 58.0 57.0 62.0 Liberia 68.0 61.3 74.7 Mali 88.0 86.4 90.6 Mauritania ... ... ... Niger ... ... ... Nigeria ... ... ... Senegal 89.7 88.2 92.4 2006 Cameroon 82.7 74.2 91.3 88.8 83.3 94.4 89.1 85.6 92.9 Ethiopia 67.3 45.9 82.0 49.0 33.2 61.8 Mauritius 8.5 9.2 7.0 16.6 11.0 14.6 Tanzania 95.0 92.5 97.3 93.3 90.2 96.3 2006 Uganda 83.4 80.9 88.0 81.8 78.9 86.9 85.1 84.1 85.9 2009 Zambia 90.9 87.1 94.9 89.0 85.0 94.0 2008 Namibia 12.3 10.4 14.4 8.8 6.7 11.3 21.7 21.5 21.9 2008 South Africa 55.3 59.5 50.0 62.7 64.7 60.2 EMPL-4.1 Informal Employment by Gender Around 2000 Around 2005 2010 or otherwise specified
SLIDE 6
Total Male Female Total Male Female Total Male Female Algeria 30.8 30.0 35.8 34.9 32.0 48.9 2004 Egypt 24.2 22.1 33.6 24.3 20.8 39.1 25.3 20.5 45.4 2007 Morocco 58.1 53.6 69.6 57.8 53.6 68.6 50.9 46.0 64.0 Tunisia ... ... ... Benin 72.8 72.0 73.7 90.3 86.1 94.1 Burkina Faso 93.8 91.1 96.4 89.7 85.9 93.3 2007 Cape Verde 42.1 29.9 56.4 31.6 28.6 35.1 28.0 21.7 40.7 Guinea Bissau 87.0 81.0 94.0 Liberia 77.9 68.3 87.3 Mali ... ... ... Mauritania 66.5 77.3 71.9 70.3 78.3 62.8 58.2 73.9 2008 Niger 91.3 90.1 94.5 Nigeria 86.2 83.7 89.9 85.8 85.2 86.9 Senegal 79.6 78.4 81.5 81.3 79.9 83.4 81.2 81.2 81.3 2006 Cameroon 76.3 64.5 88.3 76.7 65.6 88.2 73.6 64.3 83.7 Ethiopia 89.6 87.5 92.3 90.1 87.8 92.5 Mauritius 17.3 19.7 12.0 16.1 17.1 14.2 15.4 16.2 13.9 Tanzania 91.2 87.3 95.0 88.6 83.5 93.4 2006 Uganda 86.5 79.4 93.6 83.2 74.6 90.4 77.3 69.0 85.2 2009 Zambia 83.7 77.5 90.3 81.3 74.4 88.8 2008 Namibia 24.7 16.9 33.3 20.5 16.4 25.8 13.1 11.0 15.7 2008 South Africa 12.7 9.6 16.7 10.2 9.0 11.7 EMPL-9.1 Proportion of Own-Account Workers and Contributing Family Workers in Total Employment by Gender Around 2000 2010 or otherwise specified Around 2005
SLIDE 7
Total Male Female Total Male Female Total Male Female Algeria ... ... ... Egypt ... ... ... Morocco 19.2 15.7 24.9 10.3 8.8 14.3 2007 Tunisia ... ... ... Benin 33.8 33.3 34.4 26.9 25.5 28.2 2007 Burkina Faso ... ... ... Cape Verde 30.3 30.2 30.4 20.2 20.1 20.4 2007 Guinea Bissau ... ... ... Liberia ... ... ... Mali ... ... ... Mauritania 10.8 16.4 5.8 11.6 18.1 6.4 2008 Niger 57.7 85.7 31.7 51.4 50.9 52.3 2008 Nigeria … … … Senegal 53.1 52.3 54.4 50.9 50.0 52.7 2006 Cameroon 37.9 34.2 41.6 38.3 34.7 42.0 2007 Ethiopia 48.1 46.4 49.6 40.7 40.9 36.8 Mauritius <1 ... ... <1 Tanzania 35.7 ... ... 33.6 Uganda 34.1 29.3 31.1 28.3 27.0 30.0 20.5 20.0 21.0 2009 Zambia 64.7 63.7 65.9 66.4 62.5 70.8 2006 Namibia ... ... ... South Africa ... ... ...
Zambia : I choose the last year available 2006 in the middle column instead of 2004 figures.
EARN-1.1 Working Poverty Rate by Gender Around 2000 Around 2005 2010 or otherwise specified
SLIDE 8
Total Male Female Total Male Female Total Male Female Urban area Rural area Urban area Rural area Urban area Rural area Algeria ... Algeria ... Egypt ... Egypt ... Morocco ... Morocco ... Tunisia ... Tunisia ... Benin 30.1 20.7 41.5 30.4 17.7 42.9 Benin 23.3 33.8 25.0 33.7 Burkina Faso 32.6 31.7 35.2 2003 Burkina Faso 32.5 32.9 2003 Cape Verde ... Cape Verde ... Guinea Bissau ... Guinea Bissau ... Liberia ... Liberia ... Mali ... Mali ... Mauritania ... Mauritania ... Niger 46.9 43.2 66.1 2008 Niger 25.8 56.2 2008 Nigeria 38.0 26.4 55.2 7.1 10.7 3.6 Nigeria 21.6 50.3 7.9 6.6 Senegal ... Senegal ... Cameroon 36.6 33.2 40.1 39.0 29.2 49.1 39.7 29.8 50.4 Cameroon 30.7 39.2 18.1 48.6 20.9 50.8 Ethiopia 37.6 40.8 32.5 Ethiopia 46.8 21.9 Mauritius 24.6 13.3 46.5 23.2 13.6 41.6 25.3 14.8 43.2 Mauritius 26.6 24.3 26.9 22.7 28.5 24.9 Tanzania 29.0 24.8 39.3 29.5 25.2 40.3 2006 Tanzania 14.7 44.0 16.5 47.1 2006 Uganda 40.3 35.2 52.5 37.7 27.9 56.5 11.3 10.8 12.3 2009 Uganda 32.0 44.6 12.2 45.4 2.3 14.9 Zambia 33.3 31.2 38.7 40.5 39.8 42.1 2008 Zambia 31.2 46.7 39.4 44.7 2008 Namibia ... Namibia ... South Africa 33.4 26.8 41.6 South Africa 28.6 55.2 EARN-2.2 Low Pay Rate (below 2/3 of median monthly earnings) by Geographical Area EARN-2.1 Low Pay Rate (below 2/3 of median monthly earnings) by Gender Around 2000 Around 2005 2010 or otherwise specified Around 2000 Around 2005 2010 or otherwise specified
SLIDE 9
Total Male Female Total Male Female Total Male Female Algeria ... ... ... Egypt ... ... ... Morocco 48.8 59.3 21.9 43.9 54.4 17.0 45.8 57.2 15.0 Tunisia ... ... ... Benin 13.4 16.6 10.2 19.8 22.8 17.1 Burkina Faso ... ... ... Cape Verde 19.9 21.9 17.7 31.2 34.0 27.8 2009 Guinea Bissau ... ... ... Liberia 42.0 43.7 40.4 Mali 19.7 13.5 47.0 4.4 4.5 4.2 Mauritania ... ... ... Niger 29.7 30.3 34.2 2008 Nigeria 27.4 28.8 25.0 30.1 41.2 26.3 Senegal 33.2 39.5 23.5 Cameroon 27.4 34.7 19.8 28.0 35.3 20.5 31.7 39.4 23.3 Ethiopia 12.2 14.9 8.5 16.3 23.5 8.6 Mauritius 21.8 23.2 18.7 22.5 25.8 15.9 20.7 24.5 13.9 Tanzania 45.0 52.0 38.2 54.3 59.9 48.9 2006 Uganda 24.8 31.6 18.2 16.0 20.8 11.4 21.4 27.4 15.9 2009 Zambia 23.2 23.6 22.8 9.2 11.7 6.6 2008 Namibia 33.1 37.0 28.6 32.2 35.8 27.7 35.7 39.3 31.2 2008 South Africa 28.9 32.4 24.5 24.1 27.9 19.1 HOUR-1.1 Excessive Hours (more than 48 hours per week) by Gender Around 2000 Around 2005 2010 or otherwise specified
SLIDE 10
Total Male Female Total Male Female Total Male Female Algeria ... ... ... Egypt ... ... ... Morocco 7.1 7.6 5.7 5.0 5.8 3.0 3.4 3.5 3.3 Tunisia ... ... ... Benin 36.2 29.0 43.5 37.9 30.2 45.0 Burkina Faso ... ... ... Cape Verde 31.2 23.9 39.5 26.0 21.3 32.1 Guinea Bissau ... ... ... Liberia 3.3 3.0 3.5 Mali 28.2 20.0 39.5 32.8 28.7 39.1 Mauritania ... ... ... Niger 69.3 68.0 65.0 2008 Nigeria … … … Senegal 60.8 53.3 72.4 Cameroon 11.9 11.0 12.9 14.3 13.9 14.7 Ethiopia 43.8 47.8 38.3 21.7 23.4 19.7 Mauritius 4.3 5.5 2.0 Tanzania 12.4 12.9 11.9 13.1 14.0 12.1 2006 Uganda 18.4 20.3 16.5 12.0 14.0 10.1 4.9 7.3 2.6 2009 Zambia 12.4 12.1 12.6 9.6 9.9 9.3 2008 Namibia 23.1 24.8 21.2 22.6 23.3 21.7 30.4 32.2 28.2 2008 South Africa 3.5 2.6 4.6 4.2 2.8 5.9 HOUR-4.1 Time-Related Underemployment Rate by Gender Around 2000 Around 2005 2010 or otherwise specified
SLIDE 11
Total Male Female Total Male Female Total Male Female Algeria ... ... ... Egypt ... ... ... Morocco 20.4 20.4 20.3 22.6 23.7 19.7 24.7 23.9 27.1 Tunisia ... ... ... Benin 7.0 7.6 6.3 7.8 8.2 7.5 Burkina Faso ... ... ... Cape Verde 48.9 54.2 42.8 48.8 50.0 47.4 2009 Guinea Bissau ... ... ... Liberia ... ... ... Mali 30.0 30.8 28.8 27.6 24.8 31.9 Mauritania ... ... ... Niger ... ... ... Nigeria 72.6 71.2 75.0 52.7 53.4 52.3 Senegal 6.0 7.2 4.1 Cameroon ... ... ... Ethiopia 41.9 35.3 51.0 60.5 51.5 70.3 Mauritius 55.1 57.4 50.8 Tanzania 42.6 35.1 49.9 32.6 26.1 39.0 2006 Uganda 56.9 48.1 65.3 72.5 66.0 78.8 73.7 65.3 81.5 2009 Zambia 64.2 64.1 64.3 81.2 78.4 84.1 2008 Namibia 61.4 57.3 66.1 61.8 57.8 66.8 59.5 55.3 64.8 2008 South Africa 67.6 64.9 71.0 71.7 69.3 75.0 HOUR-6.1 Rate of Workers with Decent Hours by Gender in % Around 2000 Around 2005 2010 or otherwise specified
SLIDE 12
Total Male Female Total Male Female Total Male Female Algeria … Egypt … Morocco … Tunisia … Benin 30.7 30.4 30.9 2008 Burkina Faso 39.3 45.5 32.8 2006 Cape Verde … Guinea Bissau … Liberia Mali 55.3 56.5 54.0 Mauritania 4.0 4.9 3.0 5.7 6.9 4.5 2008 Niger 42.1 40.9 43.2 2009 Nigeria 39.4 38.3 30.1 2001 Senegal 12.6 17.0 8.2 Cameroon 27.9 2007 Ethiopia … Mauritius … Tanzania 31.3 32.8 29.7 27.5 30.8 24.0 2006 Uganda … Zambia 36.4 37.3 35.6 22.8 23.6 22.0 2008 Namibia … South Africa … ABOL-1.1 Child Labour Rate (5-17 year) by Gender (%) Around 2000 Around 2005 2010 or otherwise specified
SLIDE 13
Age group Total Male Female Total Male Female Total Male Female Algeria ... Egypt ... Morocco 7-17 14.5 17.8 11.0 10.5 13.3 7.7 7.2 9.7 4.6 Tunisia ... Benin 5-17 34.0 33.5 34.7 2008 Burkina Faso 5-17 58.4 59.9 56.8 31.7 31.7 31.3 2007 Cape Verde … Guinea Bissau 5-17 15.0 12.0 18.0 Liberia ... Mali 5-17 68.3 68.7 68.0 Mauritania ... Niger 5-17 50.4 47.7 53.1 2009 Nigeria … Senegal 5-17 19.7 25.6 13.8 Cameroon 10-17 20.4 19.1 21.7 42.0 42.0 42.1 39.6 42.3 36.9 Ethiopia 5-17 57.2 52.1 62.0 2001 Mauritius 12-17 5.6 7.9 3.3 4.7 6.3 3.0 2.5 3.7 1.1 Tanzania ... Uganda ... Zambia 5-17 45.8 46.8 44.9 33.7 34.8 32.6 2008 Namibia 6-17 71.9 71.2 72.5 South Africa 7-17 24.2 23.8 24.7 ABOL-6.1 Share of Children in Employment by Gender (%) Around 2000 Around 2005 2010 or otherwise specified
SLIDE 14
Total Male Female Total Male Female Total Male Female Algeria ... ... ... Egypt ... ... ... Morocco 4.0 4.8 2.0 5.0 6.1 2.3 7.6 9.0 3.6 Tunisia ... ... ... Benin 10.8 11.6 10.0 15.3 17.8 13.1 Burkina Faso 17.0 15.7 18.3 25.0 23.8 26.1 2007 Cape Verde … … … Guinea Bissau ... ... ... Liberia ... ... ... Mali ... ... ... Mauritania 17.4 16.8 24.3 18.6 19.0 17.6 2008 Niger 33.4 35.4 24.6 2008 Nigeria … … … Senegal 59.0 54.9 63.9 Cameroon 11.1 12.7 9.5 25.1 24.3 25.9 Ethiopia 67.4 64.9 72.3 62.4 59.2 67.2 Mauritius 0.8 0.6 1.2 0.2 0.2 0.3 Tanzania 57.8 58.4 56.5 2006 Uganda 72.8 72.1 77.6 71.2 72.0 69.3 85.5 87.3 82.0 2009 Zambia 69.4 63.7 75.4 59.1 53.6 65.2 2008 Namibia 17.6 14.5 21.1 17.3 14.4 21.0 18.5 18.1 19.0 2008 South Africa 24.2 23.5 25.2 23.5 22.7 24.6 2007 STAB-1.1 Proportion of Employed Population in Precarious Types of Work by Gender (%) Around 2000 Around 2005 2010 or otherwise specified
SLIDE 15 Total Agri- culture Industry Services Total Agri- culture Industry Services Total Agri- culture Industry Algeria ... Egypt ... Morocco 12.1 0.0 7.9 13.7 13.6 0.0 6.9 15.7 18.4 0.0 11.8 Tunisia ... Benin ... Burkina Faso 23.1 9.5 30.3 Cape Verde 43.4 8.3 25.2 50.1 29.6 0.0 6.1 Guinea Bissau ... Liberia ... Mali ... Mauritania 28.2 30.9 46.7 31.6 29.9 33.4 50.3 Niger ... Nigeria 41.1 41.5 41.2 41.0 39.1 36.7 39.3 Senegal ... Cameroon ... Ethiopia 15.0 14.4 13.0 15.2 11.0 20.3 0.0 6.2 Mauritius 19.3 0.0 11.6 22.1 25.0 5.5 15.0 28.6 26.6 44.9 19.6 Tanzania 11.7 17.4 Uganda ... Zambia 39.2 26.7 Namibia 47.3 44.5 36.9 56.1 43.8 36.5 29.5 52.0 44.0 21.6 37.8 South Africa 32.2 25.7 30.3 41.1 31.9 11.0 29.1 EQUA-2.1 Female Share of Employment in High-status Occupations (ISCO-88 groups 11, 12) by Economic Sector (%) Around 2000 Around 2005 2010 or otherwise specified
SLIDE 16 Total Paid employment Self employment Total Paid employment Self employment Total Paid employment Self employment
Algeria ... ... ... Egypt ... ... ... Morocco ... ... ... Tunisia ... ... ... Benin ... ... ... Burkina Faso ... ... ... Cape Verde … 28.9 40.7 2009 Guinea Bissau ... ... ... Liberia ... ... ... Mali ... ... ... Mauritania ... ... ... Niger ... ... ... Nigeria ... ... 41.4 45.1 Senegal ... ... ... Cameroon ... ... ... Ethiopia ... 38.8 38.8 Mauritius 41.4 41.1 41.3 36.3 34.6 50.1 36.9 35.6 53.4 Tanzania 50.5 27.3 56.8 40.3 25.6 43.7 2006 Uganda ... ... ... Zambia ... ... 17.9 2008 Namibia ... ... 13.1 2008 South Africa 30.0 23.1 52.0 EQUA-3.1 Gender Wage Gap by Type of Employment (%) Around 2000 Around 2005 2010 or otherwise specified
SLIDE 17
SLIDE 18 Country Last year available Total employmen t 0_ Armed forces 1_ Legislators, administrat
managers 2_ Professiona ls 3_ Technicians and associate professiona ls 4_ Clerks 5_ Service workers and shop sales workers 6_ Skilled agricultural and fishery workers 7_ Craft and related workers 8_ Plant and machine
and assemblers 9_ Elementary
10_ Others Algeria N 2004 17.4 ... 4.9 31.6 37.0 37.0 6.7 17.7 26.8 1.9 12.1 ... Egypt N 2007 21.3 ... 11.1 33.8 34.3 29.5 10.5 31.7 3.5 4.3 9.4 ... Morocco N 2010 26.9 ... 18.4 39.9 33.7 38.3 9.9 19.6 15.8 3.0 39.0 ... Tunisia N ... Benin W ... Burkina Faso W ... Cape Verde W 2010 … 3.5 38.2 55.7 38.5 57.8 60.4 28.7 9.6 9.4 57.1 0.0 Guinea Bissau W ... Mali W ... Mauritania W ... Niger W ... Nigeria W 2010 36.2 … 44.9 17.7 28.3 28.4 54.3 57.3 29.6 40.0 14.4 … Senegal W … Cameroon M ... Ethiopia E 2005 48.1 ... 19.7 28.9 30.8 56.1 68.0 26.5 68.8 21.9 67.7 ... Mauritius E 2010 35.6 ... 26.7 38.0 48.3 57.7 40.7 22.1 12.7 26.7 42.6 ... Tanzania E 2006 51.1 ... 16.5 35.0 39.1 50.7 47.7 53.8 23.0 12.9 58.5 ... Uganda E 2009 51.6 ... 7.9 46.6 40.5 64.1 54.8 56.4 33.3 4.4 39.5 ... Zambia E 2008 48.1 ... 26.8 38.7 38.6 45.1 50.0 51.5 24.6 9.5 39.5 … Namibia S 2008 44.0 ... 44.8 59.3 53.1 69.3 55.9 22.5 16.8 5.7 54.8 ... South Africa S 2010 43.4 ... 29.7 45.4 55.0 68.8 45.0 27.8 11.6 14.0 41.6 96.1 EQUA-1.1 Female share of employment by major occupational group (ISCO-88), %
SLIDE 19
South Africa Namibia Zambia UgandaTanzania Mauritius Ethiopia Nigeria Liberia Cape Verde Morocco Egypt Algeria Country S S E E E E E W W W N N N 2010 2008 2008 2009 2006 2010 2005 2010 2010 2010 2010 2007 2004 Last year available ISCO-88ISCO-88ISCO-88ISCO-88 TASCO NCO ISCO-88ISCO-88ISCO-08ISCO-88 NNP ISCO-88ISCO-88 Classificatio n used 43.42 43.97 48.10 51.60 51.10 35.61 48.10 36.20 49.40 … 26.89 21.33 17.43 Total employment ... ... ... ... ... ... ... … ... 3.51 ... ... ... 0_ Armed forces 29.73 44.84 26.80 7.89 16.50 26.71 19.70 44.90 19.70 38.22 18.41 11.11 4.87 1_ Legislators, 45.45 59.31 38.70 46.57 35.00 37.98 28.90 17.70 37.70 55.71 39.90 33.80 31.61 2_ Professional 54.99 53.05 38.60 40.53 39.10 48.27 30.80 28.30 27.70 38.49 33.75 34.27 37.02 3_ Technicians 68.84 69.34 45.10 64.13 50.70 57.72 56.10 28.40 20.50 57.77 38.29 29.47 36.99 4_ Clerks 45.00 55.91 50.00 54.78 47.70 40.71 68.00 54.30 65.60 60.37 9.91 10.46 6.69 5_ Service workers and 27.79 22.50 51.50 56.43 53.80 22.09 26.50 57.30 46.80 28.73 19.62 31.70 17.71 6_ Skilled agricultural 11.61 16.77 24.60 33.29 23.00 12.73 68.80 29.60 28.60 9.61 15.81 3.47 26.77 7_ Craft and related 14.02 5.70 9.50 4.42 12.90 26.71 21.90 40.00 15.90 9.43 3.04 4.28 1.92 8_ Plant and machine 41.63 54.77 39.50 39.49 58.50 42.55 67.70 14.40 54.60 57.05 38.99 9.38 12.11 9_ Elementary 96.07 ... … ... ... ... ... … ... 0.00 ... ... ... 10_ Others
SLIDE 20
Non fatal Fatal Non fatal Fatal Non fatal Fatal Algeria ... ... Egypt 2127.0 7.0 1580.0 6.5 2003 Morocco ... ... Tunisia ... ... Benin ... ... Burkina Faso 1919.4 7.4 1514.2 6.9 541.6 5.1 2007 Cape Verde … … Guinea Bissau ... ... Liberia ... ... Mali ... ... Mauritania ... ... Niger * 0.6 0.0 0.6 0.1 0.5 0.0 2009 Nigeria ... ... Senegal ... ... Cameroon ... ... Ethiopia 126.1 0.4 284.3 1.9 Mauritius 938.6 0.9 599.7 1.2 259.1 0.2 2009 Tanzania ... ... Uganda ... ... Zambia ... ... Namibia 100.0 1.3 104.2 4.2 2004 South Africa ... ...
* rate per 1 000 000 hours worked by workers covered by a collective agreement
SAFE-1/2.1 Occupational injury rate (non fatal/fatal) , per 100'000 employees Around 2000 Around 2005 2010 or otherwise specified
SLIDE 21
per 10,000 paid employed per 10,000 employed persons per 10,000 paid employed per 10,000 employed persons per 10,000 paid employed per 10,000 employed persons Algeria ... ... Egypt ... ... Morocco 1.0 0.4 Tunisia ... ... Benin ... ... Burkina Faso 0.4 0.6 2008 Cape Verde … … Guinea Bissau ... ... Liberia ... ... Mali ... ... Mauritania ... ... Niger ... 0.3 0.2 0.2 Nigeria … … Senegal ... 0.1 0.2 Cameroon ... ... Ethiopia 0.4 0.0 0.5 0.3 Mauritius 1.6 1.3 Tanzania 0.4 0.0 0.3 0.0 2009 Uganda ... ... Zambia ... 0.1 0.2 0.1 Namibia ... 1.0 2004 South Africa ... 0.7 0.6 2009 SAFE-4.1 Number of labour inspectors per 10,000 paid employed/per 10,000 employed persons Around 2000 Around 2005 2010 or otherwise specified
SLIDE 22 Total Government Contributory Total Government Contributory Total Government Contributory Male Female Male Female Male Female Algeria 55 women / 60 men ... Algeria … Egypt 60 ... Egypt … Morocco 60 13.6 15.0 16.4 Morocco 24.8 1.3 27.3 1.3 30.6 2.0 Tunisia 60 ... Tunisia … Benin 60 ... Benin … Burkina Faso 65 2.2 2.4
2008
Burkina Faso … Cape Verde 60 women / 65 men 1.9 1.9 51.8 46.6 5.2 67.8 61.3 6.5 Cape Verde 11.1 3.4 Guinea Bissau ... Guinea Bissau … Liberia 60 Liberia … Mali 58 Mali … Mauritania 65 ... Mauritania … Niger 60 1.1 1.2 1.3
2009
Niger … Nigeria 50 Nigeria … Senegal 60 9.4 9.7 Senegal 16.4 2.7 14.7 6.7 Cameroon 65 5.4 4.9 Cameroon 9.5 1.3 9.0 1.4 Ethiopia 55 --> 2005, 60 onwards 8.3 ... ... 8.7 8.7 Ethiopia 8.1 8.6 9.2 8.1 9.9 7.5 Mauritius 55 ... 100.0 32.0 100.0 33.0 100.0 36.0
2007
Mauritius … Tanzania 60 3.0 2.2 0.8 4.2 3.1 1.1 Tanzania … Uganda 55 ... ... ... Uganda … Zambia 55 7.3 11.2 12.3
2006
Zambia 16.7 2.2 18.7 2.6 2006 Namibia ... Namibia … South Africa 55 ... ... 46.4 46.8 South Africa 35.6 54.6 39.2 52.6 2006 2006 SECU-1.2 Share of Population aged 65 and above (or above retirement age) Benefiting from a Pension by Gender SECU-1.1 Share of Population aged 65 and above (or above retirement age) Benefiting from a Pension (%) Around 2000 Retirement age Around 2000 Around 2005 2010 or otherwise specified 2010 or otherwise specified Around 2005
SLIDE 23
Total Male Female Total Male Female Total Male Female Algeria ... ... ... Egypt ... ... ... Morocco ... ... ... Tunisia ... ... ... Benin ... ... ... Burkina Faso 3.1 ... ... 3.6 4.3 2009 Cape Verde 11.6 14.2 8.7 16.9 19.9 13.7 30.9 31.3 30.4 Guinea Bissau ... ... ... Liberia ... ... ... Mali ... ... ... Mauritania ... ... ... Niger ... ... ... Nigeria … … … Senegal 8.0 ... ... 2002 Cameroon ... ... ... Ethiopia 1.3 1.7 0.9 1.2 1.5 0.9 1.7 2.1 1.2 2007 Mauritius 45.7 44.5 47.9 2008 Tanzania 3.6 5.3 2.0 2006 Uganda ... ... ... Zambia 8.2 11.4 4.7 10.2 14.3 5.8 2008 Namibia 29.8 35.9 24.0 33.5 38.5 28.3 22.9 26.4 19.7 2008 South Africa 50.0 53.1 46.0 45.8 48.0 43.0 SECU-5.1 Share of Economically Active Population Contributing to a Pension Scheme by Gender (%) Around 2000 Around 2005 2010 or otherwise specified
SLIDE 24
Total HealthCare Exp. Other Social Security Exp. Total HealthCare Exp. Other Social Security Exp. Total HealthCare Exp. Other Social Security Exp. Algeria ... ... ... Egypt ... ... ... Morocco ... 1.3 ... 1.4 1.3 2009 Tunisia ... ... ... Benin ... ... ... Burkina Faso 0.7 … … 1.1 1.4 2007 Cape Verde … … … Guinea Bissau ... ... ... Liberia ... ... ... Mali ... ... ... Mauritania ... ... 0.9 1.0 2007 Niger ... ... ... Nigeria … … … Senegal ... ... ... Cameroon ... 0.7 0.4 0.9 0.4 0.9 0.4 2008 Ethiopia ... 0.7 ... 0.7 0.6 Mauritius ... 2.0 5.2 2.2 5.3 2.2 5.3 2009 Tanzania 3.9 2.9 1.0 5.1 3.4 1.7 2007 Uganda ... ... ... Zambia 7.5 5.9 1.6 7.6 5.7 1.9 2008 Namibia ... 5.2 ... 3.4 3.2 South Africa 3.4 4.1 3.5 SECU-2.1 Public Social Security Expenditure (% of GDP) Around 2000 Around 2005 2010 or otherwise specified
SLIDE 25 Around 2000 Around 2005 2010 or
specified Algeria ... Egypt ... Morocco 5801 Tunisia ... Benin ... Burkina Faso 3079 4816 2951 2008 Cape Verde … Guinea Bissau ... Liberia ... Mali ... Mauritania 940 1835 3211 Niger ... Nigeria … Senegal 190 Cameroon ... Ethiopia 24 105 166 Mauritius 747 882 1037 Tanzania 826 2008 Uganda ... Zambia 132 190 292 Namibia ... South Africa ... DIAL-2.1 Entreprises that are members of all employers' federation, number
SLIDE 26 Total Male Female Total Male Female Total Male Female Algeria … Egypt … Morocco … Tunisia … Benin 1.9 3.0 0.8 1.6 2.8 0.6 Burkina Faso … Cape Verde … Guinea Bissau … Liberia … Mali … Mauritania … Niger 0.4 0.4 0.3 0.1 0.1 0.1 0.3 0.3 0.5 Nigeria … Senegal … Cameroon 1.9 3.2 0.6 Ethiopia 1.1 0.9 1.4 18.0 17.9 18.1 Mauritius 27.4 22.5 37.3 25.1 22.1 30.9 Tanzania 26.6 24.9 30.9 23.0 21.7 26.3 20.2 20.9 25.1 Uganda 7.0 5.0 18.0 10.1 9.0 12.0 Zambia 52.0 38.0 Namibia 1.8 1.6 4.4 2.3 South Africa 28.9 31.0 26.2 30.0 31.8 27.7 DIAL-1.1 Trade Union Density Rate by Gender (%) Around 2000 2010 or otherwise specified Around 2005
SLIDE 27
Total Male Female Total Male Female Total Male Female Urban area Rural area Urban area Rural area Urban area Rural area Algeria ... Algeria … Egypt ... Egypt … Morocco ... Morocco … Tunisia ... Tunisia … Benin ... Benin … Burkina Faso ... Burkina Faso … Cape Verde … Cape Verde … Guinea Bissau ... Guinea Bissau … Liberia ... Liberia … Mali ... Mali … Mauritania ... Mauritania … Niger ... Niger … Nigeria … Nigeria … Senegal ... Senegal … Cameroon ... Cameroon … Ethiopia 1.2 1.3 1.1 0.4 0.5 0.3 Ethiopia 1.3 1.2 0.6 0.1 Mauritius ... Mauritius … Tanzania ... Tanzania … Uganda Uganda … Zambia ? 52.0 38.0 Zambia … Namibia ... Namibia … South Africa 32.7 34.5 30.3 South Africa 34.8 24.3 DIAL-3.2 Collective Bargaining Coverage Rate by Geographical Area (%) DIAL-3.1 Collective Bargaining Coverage Rate by Gender (%) Around 2000 Around 2000 Around 2005 2010 or otherwise specified 2010 or otherwise specified Around 2005
SLIDE 28 Currency Around 2000 Around 2005 2010 or
specified Algeria ... Egypt ... Morocco Dirham 1998 2.9% 2.9% 3.6% Tunisia ... Benin ... Burkina Faso FCFA 1999 0.3% 5.9% 1.6% 2007 Cape Verde … Guinea Bissau ... Liberia ... Mali ... Mauritania ... Niger ... Nigeria … Senegal FCFA 1999
12.9% Cameroon FCFA 2000 1.1%
2006 Ethiopia Ethiopian Birr 2000 7.4% 7.4% 2007 Mauritius Mauritian Rupee 2000 3.7% 1.7% 2.6% 2009 Tanzania ... 3.3% 6.6% 4.2% 2008 Uganda ... Zambia Zambia kwacha 2000
29.7% 2006 Namibia Namibian dollar 5.2% 0.0% 1.0% 2008 South Africa South African rand
3.6% CONT-3.1 Labour Productivity Growth Rate (%)
SLIDE 29 Around 2000 Around 2005 2010 or
specified Algeria ... Egypt ... Morocco 1.6 3.0 3.7 Tunisia ... Benin 4.9 2.9 2.6 Burkina Faso 1.9 8.7 6.4 2008 Cape Verde 6.1 6.5 6.2 2008 Guinea Bissau 0.2 3.8 2.0 2006 Liberia ... Mali 5.3 5.8 Mauritania ... Niger 7.5 7.4 8.1 Nigeria 5.4 6.5 7.9 Senegal 3.2 5.6 4.2 Cameroon 4.2 2.3 1.9 2009 Ethiopia 12.6 10.4 Mauritius 8.2 1.5 4.2 Tanzania 5.1 7.4 7.5 2008 Uganda 8.8 10.0 5.6 Zambia 3.6 5.3 7.6 Namibia 1.2 2.5
2009 South Africa 5.6 2.8 Around 2000 Around 2005 2010 or
specified Algeria ... Egypt ... Morocco 1.9 1.0 0.9 Tunisia ... Benin 4.2 5.4 2.1 Burkina Faso
6.4 0.8 2008 Cape Verde … Guinea Bissau 7.2 Liberia ... Mali 1.5 1.2 Mauritania 6.8 12.1 6.3 Niger 2.9 0.1 0.9 2009 Nigeria 14.5 11.6 11.8 Senegal 0.7 1.7
Cameroon 1.2 1.9 1.3 Ethiopia 9.9 5.0 Mauritius 4.2 4.9 2.9 Tanzania 5.9 5.0 10.3 2008 Uganda 3.4 8.6 2.1 Zambia 26.1 18.3 8.5 Namibia 9.3 2.2 4.5 CONT-11.1 GDP annual growth rate (%) CONT-5.1 CPI growth rate (%)
SLIDE 30
South Africa 4.6 4.3
SLIDE 31
Total Male Female Total Male Female Total Male Female Algeria ... Egypt ... Morocco ... Tunisia ... Benin ... 2.1 2.0 1.4 1.5 Burkina Faso ... Cape Verde 19.9 18.8 14.3 10.9 11.1 8.8 Guinea Bissau ... Liberia ... Mali 59.2 56.4 62.3 Mauritania 35.1 34.6 35.6 27.3 25.6 29.0 2008 Niger 65.9 58.7 73.1 47.6 38.1 57.2 27.1 18.1 36.1 Nigeria 32.0 31.3 32.9 23.6 23.0 24.4 Senegal 7.7 14.0 5.5 8.1 7.2 9.0 8.6 7.9 9.2 2008 Cameroon 9.0 8.4 9.7 6.1 5.6 6.6 6.1 5.4 6.9 Ethiopia 53.9 48.6 59.3 42.8 40.0 45.0 2009 Mauritius 6.6 6.8 6.4 4.3 4.6 4.0 Tanzania ... Uganda 16.3 16.8 15.7 19.4 19.1 20.1 21.3 21.8 21.1 2009 Zambia 36.1 34.8 37.7 35.1 33.8 36.4 32.5 32.2 32.9 2008 Namibia 27.5 24.4 24.0 22.3 2006 South Africa 7.7 7.7 7.7 4.3 4.2 4.4 CONT-1.1 Children not in School by Gender (%) Around 2000 Around 2005 2010 or otherwise specified
SLIDE 32
5-9 years 10-14 years 15-17 years 5-9 years 10-14 years 15-17 years 5-9 years 10-14 years 15-17 years
Algeria ... Egypt ... Morocco 21.6 18.3 45.5 13.8 11.0 37.2 Tunisia ... Benin ... Burkina Faso ... Cape Verde … Guinea Bissau ... Liberia 30.5 17.1 Mali ... Mauritania ... Niger ... Nigeria 42.3 20.8 28.8 30.5 15.9 19.7 Senegal 1.7 4.7 42.2 1.7 5.3 21.8 1.8 7.3 20.2 2008 Cameroon ... Ethiopia 43.5 47.5 72.7 30.2 36.9 61.9 2009 Mauritius 0.8 3.4 21.4 1.0 1.7 13.9 Tanzania 21.2 39.0 9.8 Uganda 21.7 6.1 25.9 26.3 8.8 27.6 26.0 6.7 26.3 2009 Zambia 53.0 16.6 35.2 55.2 15.1 27.1 54.9 12.0 27.6 2008 Namibia 42.0 10.9 21.8 28.0 7.5 19.1 2006 South Africa 12.3 1.9 9.8 5.0 1.1 8.5 CONT-1.2 Children not in School by Age (%) Around 2000 Around 2005 2010 or otherwise specified
SLIDE 33
Agriculture Industry Services Agriculture Industry Services Agriculture Industry Services
Algeria ... Egypt ... Morocco 47.9 18.7 33.2 46.5 19.2 34.2 40.9 21.9 37.1 Tunisia ... Benin ... Burkina Faso 84.4 3.1 12.5 66.9 8.1 25.0 2007 Cape Verde 22.2 19.9 57.9 29.7 18.6 51.8 13.5 7.8 78.6 Guinea Bissau 75.0 3.0 22.0 Liberia Mali ... Mauritania 29.1 2.3 7.4 13.1 3.0 17.2 2008 Niger ... Nigeria 59.9 5.6 33.8 59.8 7.6 43.3 Senegal 55.7 15.4 28.9 52.9 14.8 32.3 49.5 14.5 36.0 Cameroon ... Ethiopia 77.7 5.9 16.3 77.7 7.3 15.0 Mauritius 11.6 36.8 51.6 9.8 32.8 57.4 8.1 29.0 62.9 Tanzania 82.3 3.0 14.8 74.6 5.0 20.3 2006 Uganda 92.0 2.3 5.7 74.3 4.4 21.3 68.0 6.1 25.5 2009 Zambia 77.7 5.3 15.2 69.8 6.8 21.0 71.3 7.5 21.0 2008 Namibia 25.7 30.1 43.5 25.9 29.2 55.7 15.6 44.1 40.2 2008 South Africa 6.4 25.1 68.4 4.9 24.5 70.6 CONT-6.1 Employment by Branch of Economic Activity (%) Around 2000 Around 2005 2010 or otherwise specified
SLIDE 34
Total Male Female Total Male Female Total Male Female Algeria ... Egypt ... Morocco 46.9 60.2 33.9 53.1 66.7 40.0 56.1 68.9 43.9 2009 Tunisia ... Benin 38.5 49.9 28.2 Burkina Faso 23.6 31.5 16.6 28.3 36.7 21.0 2007 Cape Verde 65.3 77.7 55.1 71.1 82.2 62.2 76.6 84.8 69.0 Guinea Bissau 60.0 36.0 Liberia ... Mali 21.0 31.0 13.0 26.0 34.0 18.0 29.4 41.6 18.8 2009 Mauritania 57.5 66.6 49.6 61.5 70.3 54.4 2008 Niger 14.1 19.6 9.4 28.7 42.9 15.1 29.0 42.8 17.1 2008 Nigeria 57.9 66.4 49.7 73.4 80.3 67.3 Senegal 48.2 23.8 49.7 28.9 52.2 33.0 Cameroon 78.2 61.9 91.9 89.6 Ethiopia 29.2 39.7 19.4 37.9 49.9 26.6 2004 Mauritius 84.3 88.2 80.5 Tanzania 71.2 78.8 64.2 74.2 81.4 67.7 2006 Uganda 66.3 78.6 58.0 69.3 80.0 57.5 69.5 81.3 60.8 2009 Zambia 79.2 82.9 74.9 72.6 82.9 62.9 73.3 82.8 65.2 2008 Namibia 80.1 80.8 85.4 82.6 2006 South Africa 76.4 77.7 75.3 81.2 82.3 80.2 CONT-7.1 Adult Literacy Rate by Gender (%) Around 2000 Around 2005 2010 or otherwise specified
SLIDE 35
Urban Area Rural Area Urban Area Rural Area Urban Area Rural Area Algeria ... Egypt ... Morocco 62.2 26.1 67.2 33.7 68.5 38.0 2009 Tunisia ... Benin 57.9 25.6 Burkina Faso ... Cape Verde 75.0 52.9 77.5 62.2 83.3 64.6 Guinea Bissau 72.0 12.0 Liberia ... Mali ... Mauritania 71.5 45.5 73.3 50.3 2008 Niger 39.9 9.1 52.0 23.4 48.8 22.3 2008 Nigeria 78.6 51.6 84.9 67.3 Senegal 55.0 19.8 55.6 23.6 62.4 26.2 Cameroon 89.0 57.3 96.4 85.0 Ethiopia 69.9 21.7 74.2 30.9 2004 Mauritius 89.5 80.3 Tanzania 87.4 66.3 89.5 68.2 2006 Uganda 86.4 63.8 85.9 64.3 89.4 65.8 2009 Zambia 86.2 75.7 90.9 63.0 88.6 65.5 2008 Namibia 89.3 75.1 93.9 77.3 2006 South Africa CONT-7.2 Adult Literacy Rate by Geographical Area (%) Around 2000 Around 2005 2010 or otherwise specified