Empirical scoring functions for docking and virtual screening - - PDF document

empirical scoring functions for docking and virtual
SMART_READER_LITE
LIVE PREVIEW

Empirical scoring functions for docking and virtual screening - - PDF document

Strasbourg Summer School on Chemoinformatics Strasbourg, June 23-27, 2014 Empirical scoring functions for docking and virtual screening Fundamentals, challenges and trends Christoph Sotriffer Institute of Pharmacy and Food Chemistry


slide-1
SLIDE 1

1

Institute of Pharmacy and Food Chemistry University of Würzburg

Am Hubland D – 97074 Würzburg

Christoph Sotriffer

Empirical scoring functions for docking and virtual screening

Fundamentals, challenges and trends

Strasbourg Summer School on Chemoinformatics Strasbourg, June 23-27, 2014

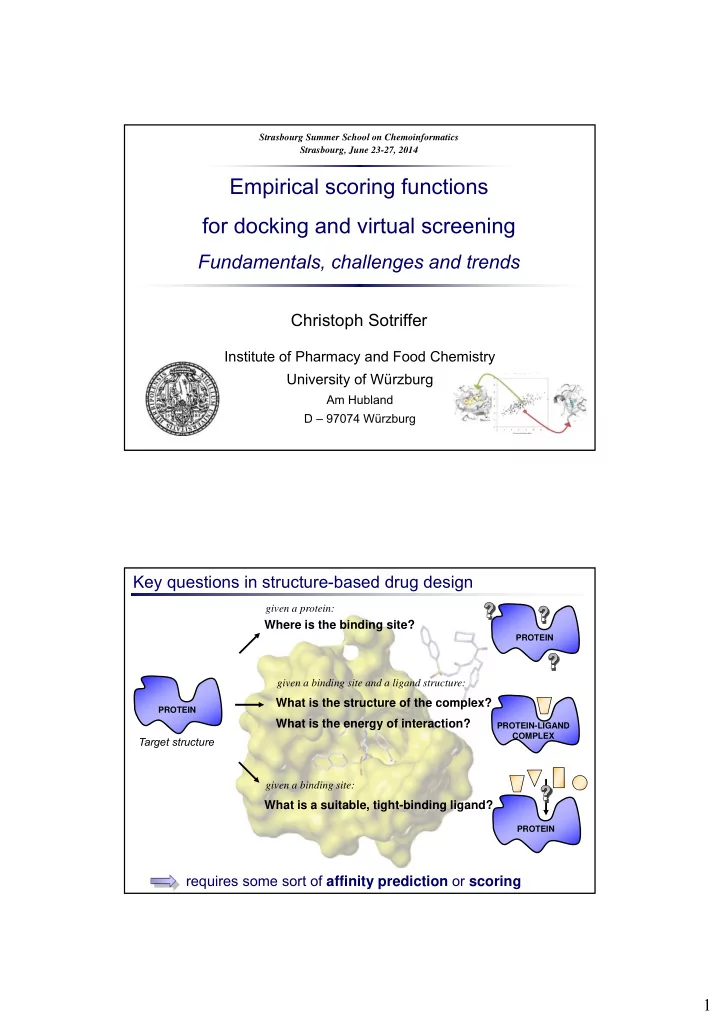
Key questions in structure-based drug design

PROTEIN PROTEIN

Where is the binding site?

given a protein: Target structure

What is the structure of the complex?

given a binding site and a ligand structure:

What is the energy of interaction?

PROTEIN-LIGAND COMPLEX

What is a suitable, tight-binding ligand?

given a binding site:

PROTEIN

requires some sort of affinity prediction or scoring

slide-2
SLIDE 2

2

Application tasks:

Scoring functions: Tasks and types

Available approaches:

  • Force field-based methods
  • Knowledge-based scoring functions
  • Empirical scoring functions

A) Determination of the correct binding mode for a given ligand B) Identification and ranking of new ligands C) Affinity prediction for compound series

Pose prediction in docking Virtual screening Ligand design, lead optimization

Force field-based methods

Scoring protein-ligand complexes:

+

for pose prediction in docking

for ligand ranking by affinity Terms accounting for (de)solvation & entropic factors required (cf. MM-PBSA)

Molecular Mechanics (MM):

  • atoms  charged spheres
  • bonds  springs
  • classical potentials
  • no electrons  no bond formation / cleavage
  • typically parameterized to reproduce

molecular potential energy surface ( conformational ∆H in the gas phase!)

slide-3
SLIDE 3

3 Knowledge-based scoring functions

Frequency of occurrence g(r) r [Å] 1 2 3 4 5 6 R-O O-R

O-R O R O O R O N R N

Pij (r) = - ln gij (r) gref

Pij: distance-dependent pair potential gij: frequency distribution of atom-atom contacts gref: reference distribution

Derivation from crystal-structure data

1 2 3 4 5 6

  • 2
  • 1

1 2 3 r [Å] Statistical potential

No experimental affinities used!

Empirical scoring functions

pKi =  pKin fn(structure) Regression-based:

affinity weighting factors structure descriptors determined via regression analysis (MLR, PLS)

Data:

Experimental binding affinities Experimental structures

slide-4
SLIDE 4

4 The prototype: SCORE1 (Böhm, 1994) Affinity prediction on generic data sets

Scoring function performance 2004

  • r: The „large-test-set“ shock …

Scoring value

Wang et al., J. Chem. Inf.

  • Comp. Sci. 44 (2004), 2114

Correlation with affinity for a test set of 800 known complexes: for most functions r < 0.50 (r2 < 0.25)

slide-5
SLIDE 5

5 Affinity prediction on generic data sets

Scoring function performance 2004

  • r: The „large-test-set“ shock …

Wang et al., J. Chem. Inf.

  • Comp. Sci. 44 (2004), 2114

Correlation with affinity for a test set of 800 known complexes: for most functions r < 0.50 (r2 < 0.25)

  • poor correlation for generic data sets
  • hardly possible to obtain correct ranking
  • of limited use for ligand optimization

How to improve empirical scoring functions?

pKi =  pKin fn(structure) Regression-based:

affinity weighting factors structure descriptors determined via regression analysis (MLR, PLS)

Development options:

  • training sets
  • descriptors
  • regression methods
slide-6
SLIDE 6

6 The SFCscore approach

  • Training sets:

Data collection from public & industry sources SFC: Scoring Function Consortium up to 855 complexes with affinity data

  • Descriptors:
  • Regression method: MLR + PLS

larger training set additional descriptors

pKi = - pKi1  n_rot_bonds + pKi2  neutral_H_bonds + pKi3  metal_interaction + pKi4  AHPDI + pKi5  ring-ring_interaction + pKi6  ring-metal_interaction + pKi7  total_buried_surface + pKi8

Example: SFCscore function „sfc_290m“

R R2 s F Q2 sPRESS 0.843 0.711 1.09 99.2 0.692 1.12 Statistical parameters for training set (n = 290):

Sotriffer et al., Proteins 73 (2008), 395 SFCscore

R R2 s F Q2 sPRESS 0.873 0.762 1.40 32.1 0.696 1.67 Comparison with SCORE1 (n = 45):

slide-7
SLIDE 7

7 2009 benchmark

Scoring function performance

Pearson correlation coefficient RP

0,587 0,644 0,1 0,2 0,3 0,4 0,5 0,6 0,7 0,8 0,9 1 SFCscore functions Functions tested by Cheng et al. 2009

  • J. Chem. Inf. Model.

49 (2009), 1079 Zilian & Sotriffer

  • J. Chem. Inf. Model.

53 (2013), 1923

Some known limitations of SFCscore:

  • data set issues (IC50 etc.)
  • implicit model assumptions (i.e.,

functional form of descriptors, linear regression techniques) Correlation of scores with experimental binding affinities

Test set compiled by Cheng et al., 2009: 195 PDBbind complexes (65 targets)

growth of PDBbind → 1005 complexes with Ki data Non-parametric machine-learning methods:

  • Training sets:

(not overlapping with Cheng & CSAR test sets)

  • Regression methods:

(not imposing any particular functional form)

Random Forest

in particular :

Addressing these limitations …

Random Forest for scoring functions

slide-8
SLIDE 8

8

Random Forest for scoring functions

First scoring function trained with Random Forest: RF-Score

(Ballester & Mitchell, Bioinformatics 2010)

  • Training set: 1105 PDBbind complexes
  • Descriptors: count of protein-ligand atom type pair contacts withing 12 Å

9 atom types (C, N, O, S, P, F, Cl, Br, I) → 36 pairs → each complex characterised by vector of 36 contact counts

RF-Score yields much higher Rp for Cheng test set! BUT: Do the pure contact counts sufficiently well capture the physicochemical interaction features?

Random Forest for scoring functions: SFCscoreRF

use SFCscore descriptors to train Random Forest model! SFCscoreRF

  • Training set: 1005 PDBbind complexes
  • Descriptors: 63 SFCscore descriptors

Increase of the mean squared error

when randomly permuting the descriptor values

Relative descriptor importance Test set (Cheng) RP = 0.779 RMSE = 1.56

Zilian & Sotriffer,

  • J. Chem. Inf. Model.

53 (2013), 1923

slide-9
SLIDE 9

9

0,587 0,644 0,776 0,779 0,1 0,2 0,3 0,4 0,5 0,6 0,7 0,8 0,9 1 SFCscore functions Functions tested by Cheng et al. 2009 RF functions

Pearson correlation coefficient RP

Zilian & Sotriffer

  • J. Chem. Inf. Model.

53 (2013), 1923

Correlation of scores with experimental binding affinities

Test set compiled by Cheng et al., 2009: 195 PDBbind complexes (65 targets)

Scoring function performance

Why does SFCscoreRF outperform the other SFCscore functions?

Applicability domain of SFCscoreRF

SFCscoreRF training data Cheng test set complexes sfc_229m training data Cheng test set complexes

better coverage

  • f training-set region

Knowing in advance the best SFCscore function for each individual complex would lead to

RP = 0.93 RMSE = 1.03

slide-10
SLIDE 10

10

CSAR-NRC HiQ evaluation set: 332 complexes

Dunbar et al., J. Chem. Inf. Model. 51 (2011), 2036; Smith et al., J. Chem. Inf. Model. 51 (2011), 2115

Correlation of scores with experimental binding affinities

One more generic test set: CSAR-NRC HiQ (2010)

Performance across 17 core methods:

  • RP in the range 0.35 – 0.76 (only 3 >0.65)
  • RMSE in the range 2.99 – 1.51 (pKd units)
  • correlation with heavy atom count: RP 0.51

SFCscoreRF: RP = 0.73 RMSE = 1.53 (pKd units)

Scoring function performance

CSAR-NRC HiQ evaluation set: 332 complexes

Dunbar et al., J. Chem. Inf. Model. 51 (2011), 2036; Smith et al., J. Chem. Inf. Model. 51 (2011), 2115

Correlation of scores with experimental binding affinities

One more generic test set: CSAR-NRC HiQ (2010)

SFCscoreRF: RP = 0.73 RMSE = 1.53 (pKd units)

Scoring function performance

Inherent experimental error

limits the possible correlation between scores and measured affinity.

RP is limited to: ∼0.91 ~0.83

when fitting to the data set when scoring the data set with a without overparameterizing method trained on outside data (estimate based on error with σ = 1.0 log K)

Dunbar et al., J. Chem. Inf. Model. 51 (2011), 2146

Where are the limits?

slide-11
SLIDE 11

11 What about individual targets?

Leave-Cluster-Out (LCO) Validation: Target-dependent performance

RMSE

  • Correl. coeff. RP

Scoring function performance Zilian & Sotriffer

  • J. Chem. Inf. Model.

53 (2013), 1923

What about individual targets?

Leave-Cluster-Out (LCO) Validation: Target-dependent performance BUT: Somewhat artificial setup …

Training set HIV-protease set

Out-of-bag (OOB) predictions for HIV-protease class (n=97): RP = 0.60 RMSE = 1.26

Scoring function performance

slide-12
SLIDE 12

12 What about individual targets and docked ligands?

The CSAR 2012 challenge

Scoring function performance

Example: ERK2 test set ~40 compounds for docking and affinity ranking rather poor results for most groups: median Rp = 0.37 best: 0.66 SFCscoreRF: 0.49 Major problem: binding-mode prediction!

What about individual targets and docked ligands?

Scoring function performance

The CSAR 2012 challenge Example: ERK2 test set Based on 12 crystal structures released later:

Damm-Ganamet et al., J. Chem. Inf. Model. 53 (2013), 1853

slide-13
SLIDE 13

13 Scoring function performance (II)

Cheng et al., J. Chem. Inf. Model. 49 (2009), 1079

rmsd < 1.0 Å rmsd < 2.0 Å rmsd < 3.0 Å Success rate for identifying best-scored ligand binding pose with

  • Test set of 195 complexes of 65 different targets
  • 100 low-energy poses per complex (0-10 Å rmsd)
  • 29 scoring functions tested

Identification of near-native binding pose among a set of geometric decoys

Pose prediction in docking

DSXCSD 85%

  • native poses can be detected fairly well
  • success rates of up to ~80%
  • knowledge-based approaches work best
  • for reduced Cheng data set (n=176), rmsd 2 Å:
  • DSXPDB: 83.5%
  • SFCscore sfc_229m (best): 38.1% !?!

SFCscore for docking pose prediction

SFCscore functions: trained on crystal structures for affinity prediction

  • insufficient information on unfavorable interactions
  • no knowledge about decoy poses

In particular: penalties on bad contacts lacking Using a simple „clash-descriptor“ as filter

Lennard-Jones potentials 1

„Clash“-scores in crystal structures

(Astex data set, Hartshorn et al.)

Filter cutoff

slide-14
SLIDE 14

14

SFCcsore for docking pose prediction

≤ 2.0 Å Pose (incl. crystal pose)

Scoring function

Prefiltering poses with „clash-descriptor“ improves pose prediction with SFCscore

RMSD to crystal pose (Å) score(crystal pose) - score

PDB 1DHI

BUT: Success rates of DSX not reached How to improve further?

SFCcsore for docking pose prediction

Learning from decoy poses

Huang: based on CSAR 2010

318 complexes (no overlap with Cheng) 500 poses/complex from Mdock & DOCK 0-18 Å RMSD (incl. native pose)

Data sets:

CSAR 2012:

58 complexes of 5 targets 199 decoy poses/complex from DOCK (2-22 Å rmsd) + 1 near-native pose (<1 Å)

Exposed/buried ligand surface Cheng Huang

slide-15
SLIDE 15

15

SFCcsore for docking pose prediction

Random Forest classification model using SFCscore descriptors based on combined C&H2 training set Used in combination with DSX ! For pose prediction / docking power calc.:

For each complex: classification with RF-model

„near-native pose(s)“ „only decoys“

if multiple poses: rank with DSX, take top pose take top-ranked DSX pose

  • Cheng/Huang test set (165 complexes):

improving from 84.2% (DSX)  to 87.3% (RF+DSX)

  • CSAR-2012 test set (58 complexes):

improving from 87.9% (DSX)  to 91.4% (RF+DSX)

PDB 4FV1

top DSX pose (wrong) top RF+DSX pose (correct)

SFCcsore for docking pose prediction

  • Cheng/Huang test set (165 complexes):

improving from 84.2% (DSX)  to 87.3% (RF+DSX)

  • CSAR-2012 test set (58 complexes):

improving from 87.9% (DSX)  to 91.4% (RF+DSX)

slide-16
SLIDE 16

16 Why is affinity prediction a challenge?

2.) The prediction methods need to be fast

Database screens: ~ 103 – 106 molecules need to be compared Docking runs: ~ 107 – 109 configurations need to be evaluated

„Scoring functions“ required: Fast, simplified, heuristic methods for prediction of binding strength

1.) Protein-ligand complexes are dynamic systems in aqueous solution

  • simultaneous, unperiodic,

continuously changing interactions

  • huge number of particles

needs integration over entire phase space! Simulation methods required! Statistical thermodynamics: Calculation of ∆G° Computationally very expensive!

Fundamental limitations of empirical scoring functions (I)

  • G0 = RT ln KD = H0 - TS0

difference between two states (bound/unbound) depending on the entire accessible phase space referring to an equilibrium observable yet scoring functions in general …

… consider only the complexed state … consider only a single (or very few) configurations … attempt to provide G0 also for arbitrary non-equilibrium states (poses)

Overall, the simplistic scoring functions work surprisingly well! And: More sophisticated approaches start appearing …

e.g.: „Blurring“; Ucisik et al., J. Chem. Theor. Comput. 10 (2014), 1314 force-field based; ensemble generation, consideration of unbound state

slide-17
SLIDE 17

17 Fundamental limitations of empirical scoring functions (II)

  • Accuracy of experimental data!

> Structural data (mainly X-ray) of protein-ligand complexes > Affinity data of protein-ligand complexes

Scoring functions cannot be better than the experimental data they are based on!

  • depend highly on pH, buffer, salt concentration, temperature
  • enyzme kinetics: inhibition mechanism must be known
  • IC50 ↔ Ki ↔ Kd
  • multiple conformations (highly dynamic systems)
  • hydrogen atom positions (protonation states) not observable
  • side-chain orientation may be ambiguous (Asn, Gln, His)
  • water molecules are only partially observable
  • binding modes may depend on crystallization conditions and crystal packing
  • J. Med. Chem. 55 (2012), 5165
  • Exp. uncertainty in Ki for heterogeneous data: MUE 0.44-0.48 pKi units

Upper limit of performance for all affinity prediction models!

  • max. performance of model with same uncertainty as exp. uncert.: Rp = 0.81
  • max. performance of a perfect model: Rp = 0.90

Scoring Function Consortium

Astra Aventis BASF Boehringer Glaxo Novo Nordisk Pfizer Agouron Roche Schering CCDC

Acknowledgement

David Zilian Michael Hein

Manuel Krug Benjamin Merget Johannes Schiebel Martin Sippel Gerhard Klebe (Univ. of Marburg) Paul Sanschagrin Gerd Neudert Hans Matter (Sanofi-Aventis) DFG (SFB 630, KFO 216)