
SLIDE 1
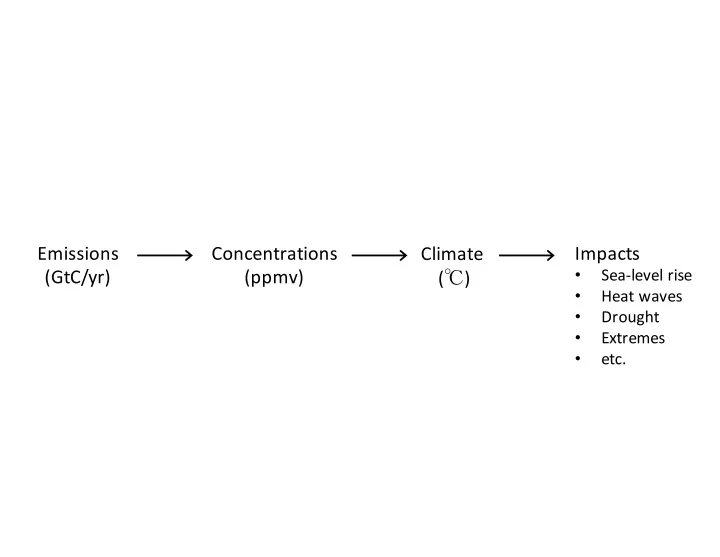
Emissions (GtC/yr) Concentrations (ppmv) Climate (℃) Impacts
- Sea-level rise
- Heat waves
- Drought
- Extremes
- etc.
Emissions Concentrations Impacts Climate (GtC/yr) (ppmv) - - PowerPoint PPT Presentation
Emissions Concentrations Impacts Climate (GtC/yr) (ppmv) Sea-level rise ( ) Heat waves Drought Extremes etc. Emissions Concentrations Impacts Climate (GtC/yr) (ppmv) Sea-level rise ( ) Heat
Solomon 2009, PNAS Year Atmospheric CO2concentration
Solomon 2009, PNAS Year Atmospheric CO2concentration Ocean heat content/thermal expansion
Solomon 2009, PNAS Year Atmospheric CO2concentration Ocean heat content/thermal expansion Year Temperature response
Solomon 2009, PNAS
Year Atmospheric CO2concentration Ocean heat content/thermal expansion Year Temperature response
Solomon 2009, PNAS
Year Atmospheric CO2concentration Ocean heat content/thermal expansion Year Temperature response
Solomon 2009, PNAS
Year Atmospheric CO2concentration Ocean heat content/thermal expansion Year Temperature response