Electricity update from Europe technology, market & regulation: - - PowerPoint PPT Presentation

electricity update from europe technology market
SMART_READER_LITE
LIVE PREVIEW

Electricity update from Europe technology, market & regulation: - - PowerPoint PPT Presentation

Electricity in Italy, the UK and Spain lessons learnt and future directions A seminar from IVAs Electricity Crossroads project. Electricity update from Europe technology, market & regulation: the case of Italy Maurizio Delfanti


slide-1
SLIDE 1

Electricity update from Europe technology, market & regulation: the case of Italy

Maurizio Delfanti maurizio.delfanti@polimi.it Politecnico di Milano Department of Energy

Electricity in Italy, the UK and Spain lessons learnt and future directions

A seminar from IVA’s Electricity Crossroads project.

slide-2
SLIDE 2
  • M. Delfanti – Stockholm, 18 March 2015

Index

2

  • Italian electricity scenario
  • RES-E support schemes:
  • principles and results
  • Technical issues for T&D networks:
  • innovative requirements for DG
  • technical connection rules
  • Regulation-driven projects / innovations:
  • smart distribution grids
  • storage operated by TSO
  • evolution of dispatching incl DSO
slide-3
SLIDE 3
  • M. Delfanti – Stockholm, 18 March 2015

Solar 9% Hydro 21% Bioenergy 6% Geotherm al 2% Wind 6% Gas 35% Coal 14% Oil 2% Other 5%

Import 46,7 Export 3,0 Industry Household Agriculture Services

Traditional sources 151,0 TWh

Pumps 1,7 Thermal 149,3 (gas 62%; coal 26%) Olio (2%) Carbone (15%) Gas naturale (38%) Altro (6%)

57% 57% 43% 43% 42% 42% 2% 2% 22% 22% 34%

Energy supplied 309,0 TWh Net import: 43,7 TWh National net Production 267,6 TWh

% of Supplied % of Net production

Pumping

Consumption

2,3 TWh

* Natural inflows hydro production,

Renewable sources 116,6 TWh

Hydro* 56,4 (48%) Geothermal 5,5 (5%) Wind 15,0 (13%) Photovoltaic 23,3 (20%) Bioenergies 16,4 (14%)

The Italian Electricity System: 2014 provisional data by Terna

  • Thermal production is the most important source (56%)
  • recent renewal of thermal generation assets
  • gas covers about 45% of the overall generated energy
  • most from modern, efficient CCGT plants
  • Renewable Energy Sources (RES) contribute for the 44%

to the overall balance

44% 56%

3

slide-4
SLIDE 4
  • M. Delfanti – Stockholm, 18 March 2015

The Italian Electric System: the electric demand

  • 2014 electric demand:
  • 309 TWh total energy
  • 51.6 GW peak power (installed: 120 GW)
  • Demand still below the values ante-2008

worldwide financial crisis:

  • 2007 peak power 57 GW
  • Significant seasonality of electric demand:
  • winter and summer peak
  • summer peak getting higher
  • low demand periods:
  • spring
  • august

4

slide-5
SLIDE 5
  • M. Delfanti – Stockholm, 18 March 2015

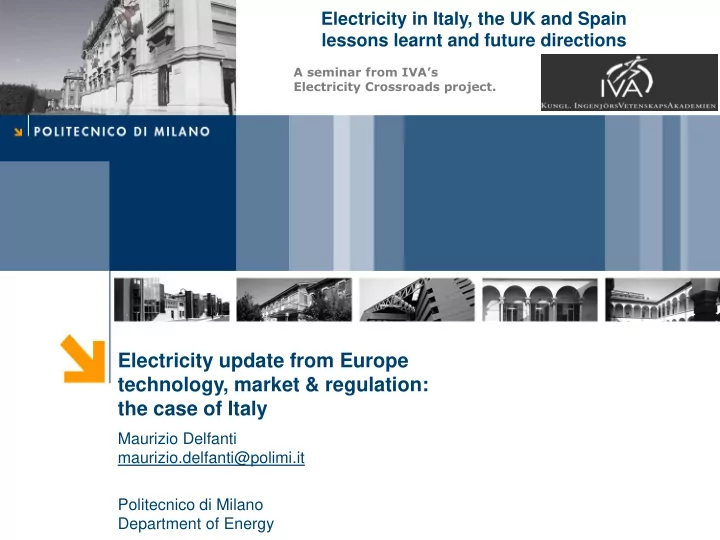
Percentage composition of the electricity price for a household consumer

In Italy network costs + general system charges are more than 35%

  • f electrical energy bill, and continue to increase…

…it is an indirect incentive to use RES for self-consumption

5,5 6,3 6,4 6,5 6,6 6,8 7,2 7,7 7,6 8,3 8,8 8,9 8,6 8,5 9,0 9,4 10,2 11,0 11,7 11,9 11,0 10,7 10,4 10,4 10,2 9,6 9,4 9,3 9,4 9,5 9,5 9,4 10,0 10,9 10,9 11,0 10,4 10,0 10,2 10,0 9,8 9,4 9,3 3,80 3,01 3,01 3,01 2,96 2,96 2,96 2,96 2,96 2,96 2,96 2,96 3,10 3,10 2,64 2,64 2,39 2,39 2,39 2,39 2,49 2,49 2,51 2,51 2,50 2,50 2,50 2,52 2,49 2,49 2,49 2,49 2,56 2,56 2,56 2,56 2,77 2,78 2,77 2,77 2,82 3,00 3,00 1,00 0,94 0,97 0,97 1,03 1,04 0,69 0,69 1,12 1,14 1,38 1,48 1,65 1,65 1,61 1,61 1,63 1,41 1,41 1,33 1,23 1,23 1,36 1,36 1,30 1,40 1,51 1,56 1,47 1,90 2,17 2,25 2,38 3,10 3,16 3,27 3,44 3,64 3,64 3,71 3,98 4,07 4,10 1,94 1,94 1,95 1,96 1,98 1,99 1,99 2,05 2,08 2,15 2,22 2,25 2,25 2,24 2,24 2,27 2,33 2,39 2,46 2,47 2,39 2,36 2,34 2,34 2,31 2,26 2,25 2,25 2,24 2,30 2,33 2,33 2,38 2,54 2,55 2,57 2,55 2,53 2,55 2,54 2,55 2,53 2,53 12,27 12,16 12,29 12,42 12,62 12,83 12,83 13,39 13,73 14,51 15,35 15,60 15,60 15,53 15,53 15,91 16,51 17,19 17,93 18,07 17,15 16,80 16,63 16,63 16,26 15,76 15,68 15,59 15,57 16,18 16,49 16,49 17,28 19,09 19,13 19,40 19,13 18,94 19,20 19,05 19,19 18,98 18,97

2 4 6 8 10 12 14 16 18 20 22 I… II III IV I… II III IV I… II III IV I… II III IV I… II III IV I… II III IV I… II III IV I… II III IV I… II ** IIIIV I…II IIIIV I…II III c€/kWh energia e approvvigionamento costi di rete

  • neri generali di sistema

imposte

Production and supply Network charges General system charges Taxes

5

slide-6
SLIDE 6
  • M. Delfanti – Stockholm, 18 March 2015

Index

6

  • Italian electricity scenario
  • RES-E support schemes:
  • principles and results
  • Technical issues for T&D networks:
  • innovative requirements for DG
  • technical connection rules
  • Regulation-driven projects / innovations:
  • smart distribution grids
  • storage operated by TSO
  • evolution of dispatching incl DSO
slide-7
SLIDE 7
  • M. Delfanti – Stockholm, 18 March 2015

Italian instruments operated by GSE to achieve the RES targets

  • GSE promotes the development of renewable energy sources and energy

efficiency in Italy, by granting economic incentives and supporting policy makers.

  • Green Certificates (phasing out)
  • Feed in tariff & Feed in premium
  • Net metering
  • Tax exemption (not by GSE…)

RES-E

  • Grants: “Heating Account”
  • White Certificates
  • Fiscal Incentives
  • EU ETS (indirect)

RES-H

  • Blending obligation
  • EU ETS (aviation)

RES-T

  • Market access

services for RES

  • Services for grid

integration

  • Certifications

(Guarantees of Origin)

  • Technical Regulation
  • Innovation for

administrative simplification

  • Monitoring,

controlling and reporting

  • Training and

information RES sector Support schemes Other measures 7

slide-8
SLIDE 8
  • M. Delfanti – Stockholm, 18 March 2015

RES-E statistics: RES capacity and production

  • Huge growth of PV in a few years (end 2014: 18,5 GW); continued growth of

wind (end 2014: 8,6 GW); recently, remarkable growth of small biogas plants

8

  • National cumulative burden charged on the customers’ bills (max: 2016):

around 15 billion € per year

slide-9
SLIDE 9
  • M. Delfanti – Stockholm, 18 March 2015

PUN electricity average price (nation-wide):

  • 2011: 72,23 €/MWh
  • 2012: 75,47 €/MWh
  • 2013: 62,99 €/MWh
  • 2014: 52,25 €/MWh

RES-E in the market: Impact on wholesale prices (yearly average per hour)

Ratio between Hourly price and PUN Impact on tariffs of the RES incentives: ~50 €/MWh

  • A peak-shaving effect can be observed, driven by the high PV generation

during the day

  • A price increase during the evening hours can be observed, where the thermal

production is prevalent

  • The strong RES penetration has significantly changed the energy price profile

9

slide-10
SLIDE 10
  • M. Delfanti – Stockholm, 18 March 2015

Reverse power flow time (RPFT): annual data  2010 ÷ 2013

Source: Enel Distribuzione 150 kV 20 kV

High Voltage Medium Voltage

Number of HV/MV transformers RPFT > 1% RPFT > 5%

Reverse power flow: the energy flows from MV network to HV network.

Reverse Power-flow Time (RPFT) indicator: the percentage of yearly time in which energy flows from MV to HV in a given PS (1-5%).

When the energy produced by DG is higher than the energy consumed by end users connected to the same MV distribution network, the network protection and automation techniques are at stake.

10

slide-11
SLIDE 11
  • M. Delfanti – Stockholm, 18 March 2015

Index

11

  • Italian electricity scenario
  • RES-E support schemes:
  • principles and results
  • Technical issues for T&D networks:
  • innovative requirements for DG
  • technical connection rules
  • Regulation-driven projects / innovations:
  • smart distribution grids
  • storage operated by TSO
  • evolution of dispatching incl DSO
slide-12
SLIDE 12
  • M. Delfanti – Stockholm, 18 March 2015

Technical issues for T&D networks

  • The system/network architecture was chosen when RES/DG were rare;

this can lead to several technical issues today (and in the next years):

  • RES: new challenges for TSOs  the system shall become more flexible

(generation dispatching; producers)

  • RES/DG: new challenges for TSOs  constraints are mainly related to the

automatic frequency disconnection of DG plants

  • RES/DG: new challenges for DSOs  constraints are mainly related to

reverse power flow

  • voltage regulation and
  • poor performance of Interface Protection Relays
  • A revision is required:
  • Distribution network management (grids from “passive” to “active”);

Distribution network protection and control devices.

  • Transmission network is affected too…

12

slide-13
SLIDE 13
  • M. Delfanti – Stockholm, 18 March 2015

Actions undertaken in Italy by the TSO (+CEI) since end 2011

New Annexes to the Grid Code dedicated to RES were issued:

  • Annex A.70 (approved by AEEG, R.O. 84/2012/R/eel – 8th Mar 2012);
  • extends some existing HV rules to the PV plants (DG on MV and LV),
  • prescribes the protection schemes to be adopted,
  • includes retrofitting of existing DG units (MV, over 50 kW)
  • Annex A.72 (approved by AEEG, R.O. 344/2012/R/eel – 2nd Aug 2012);
  • all RES fed DG (P>50 kW, MV connected) become curtailable on a TSO

command (includes new & existing DG units!)

  • DG connected to main MV busbars are disconnected by DSOs (30 min)
  • DG_PRO: other DG units are disconnected on advice by producers (days)
  • MV & LV Connection Standards (enforced by AEEG) to be adopted for the

new power plants (CEI 0-16 & CEI 0-21), were duly updated

13

slide-14
SLIDE 14
  • M. Delfanti – Stockholm, 18 March 2015

50 49.7 49.1 47.5 50.3 51.5 CONVENTIONAL GENERATION TRIP MV-LV GD TRIP UNDER-FREQUENCY LOAD SHEDDING CONVENTIONAL GENERATION TRIP MV-LV GD TRIP 50 49.7 49.1 47.5 50.3 51.5 MV-LV GD TRIP MV-LV GD TRIP UNDER-FREQUENCY LOAD SHEDDING CONVENTIONAL GENERATION TRIP CONVENTIONAL GENERATION TRIP

DG on MV-LV grids

  • Before April 1st 2012 normal operation between

49.7 Hz and 50.3 Hz

  • After April 1st 2012: MV  47.5 to 51.5 Hz

+ retrofitting and LV  49 Hz to 51 Hz Power plants on EHV/HV grids

  • Normal operation between 47.5 Hz and 51.5 Hz

Innovative Italian IPS: wider thresholds and voltage unlock

Retrofit program: the application of these requirements to the existing DG plants has followed this timing:

  • update to A.70 for plants connected

to MV networks with P > 50 kW (≈ 16 GW): March 2013 (DONE!);

  • update to A.70 for plants connected

to MV networks with P ≤ 50 kW (≈ 2 GW): June 2014 (DONE!);

  • update to A.70 for plants connected

to LV networks with P > 6 kW: April 2015 (WIP);

14

BEFORE APRIL 2012 AFTER APRIL 2012

slide-15
SLIDE 15
  • M. Delfanti – Stockholm, 18 March 2015

Primary substation

Curtailment of DG active power: MV wind and PV plants

Wind and PV plants (P>100 kW, MV connected) become curtailable

  • n a TSO command

through DSO control center

TSO

Gateway TSO DSO Operation Center DSO 1

Modem GSM/GPRS

GD 1

Modem GSM/GPRS

GD 2

MV network

Overgeneration

Conventional generation insufficient Operation Center DSO 2

15

Retrofit program:

  • update to A.72 for wind and PV

plants connected to MV grids with P ≥ 100 kW (≈10 GW): January 2016 (WIP!)

  • update to A.72 for DSO:

September 2015 (WIP!)

slide-16
SLIDE 16
  • M. Delfanti – Stockholm, 18 March 2015

Index

16

  • Italian electricity scenario
  • RES-E support schemes:
  • principles and results
  • Technical issues for T&D networks:
  • innovative requirements for DG
  • technical connection rules
  • Regulation-driven projects / innovations:
  • smart distribution grids
  • storage operated by TSO
  • evolution of dispatching incl DSO
slide-17
SLIDE 17
  • M. Delfanti – Stockholm, 18 March 2015
  • DISTR. NETWORK

AUTOMATION DISTRIBUTED GENERATION VOLTAGE REGULATION MICRO GENERATION

active grid

ELECTRIC VEHICLES RECHARGING INFRASTRUCTURE

E-mobility

AEEG DECISION 292/06 AEEG DECISION 242/10 AEEG DECISION 39/10 AEEG DECISION 5/10 ELECTRONIC METERS smart metering ENERGY EFFICIENCY SMART APPLIANCES

DR & EE

DEMAND AGGREGATION DEMAND RESPONSE LARGE SCALE

  • INTERMITT. GD

wind integr.

AEEG DECISION 103/03 STORAGE SYSTEMS

storage

V-2-G SERVICES

System evolution in Italy is mainly driven by Regulation Many Decisions by NRA (Regulatory Orders, RO) have been issued on several critical points

ERGEG Smart Grids Consultation Paper (Dec-2009)

AEEG DECISION 199/11 AEEG DECISION 84/12 AEEG DECISION 344/12

Actions undertaken in Italy by the National Regulatory Authority (AEEG)

17

slide-18
SLIDE 18
  • M. Delfanti – Stockholm, 18 March 2015

Requirements

  • Focus on MV networks: 75% of DG rated power
  • Active grids: at least reverse power-flow for 1% of time
  • Real time control system at MV level: the selected MV network has to

be controlled (voltage limits / anti-islanding)

  • Open grid: non-proprietary communication protocols only

Lessons learned

  • Existing public Internet infrastructure is fully compatible with the

majority

  • f

SG applications (transfer trip; V/Q regulation; limitation/modulation of active power, even if no specific agreements with TLC providers are signed.

Smart grids demo projects (AEEG R.O. 39/10): lessons learned

18

slide-19
SLIDE 19
  • M. Delfanti – Stockholm, 18 March 2015

Storage operated by the TSO: energy intensive projects (AEEG R.O. 288/12, 66/13)

  • In some areas (as some regions in Southern Italy) the HV grid has no

sufficient capacity to accept all the NP-RES

  • 470 GWh of “curtailed wind energy” in 2010, progressively decreased until

2012 (again increasing in 2013 but for different reasons)

  • The

“curtailed wind energy” must be replaced by conventional production (and payed to the curtailed generators too)

  • On a shorter term: well scaled and located

energy storage systems could be a choice: 6 projects, total rated energy > 200 MWh

19

slide-20
SLIDE 20
  • M. Delfanti – Stockholm, 18 March 2015

Power intensive storage systems can help overcoming some issues that jeopardize system security, like:

  • reduced regulating capacity & inertia;
  • variability & unpredictability of RES (wind);

Industry Ministry approved 40 MW of Power Intensive Pilot projects by TERNA AEEG (res. 43/13/R/eel) approved two power intensive projects (total 16 MW), one in Sicily and one in Sardinia (these islands are weakly interconnected with the continental system). Based on the results of this first experiment, AEEG will define how to implement the remaining capacity.

Storage operated by the TSO: power intensive projects (AEEG R.O. 288/12 and 43/13)

20

slide-21
SLIDE 21
  • M. Delfanti – Stockholm, 18 March 2015

The new role of DSOs: ancillary services from RES towards a local dispatch

  • Dispatching can benefit from the development of network infrastructure.
  • RES plants (big plants connected on HV and EHV transmission networks and

DG connected to the MV and LV distribution networks) will participate in markets (DAM; ASM) and will provide dispatching resources (like conventional plants)

  • DSOs will provide market access to DG by acting as market facilitators:
  • many ancillary services by DG will be enabled through smart grids:

advanced information exchange (DSO / generation / consumption, provision of ancillary services at distributed level, advanced grid management.

  • this new role by the DSOs could lead to different business models,

presented in a recent Consultation Document of the National Regulator

DCO 354/R/eel http://www.autorita.energia.it/allegati/docs/13/354-13all.pdf

21

slide-22
SLIDE 22
  • M. Delfanti – Stockholm, 18 March 2015

Possible models for local dispatch:

  • 2. Local Dispatch by the DSO

TSO

  • Trader (DG with rated power ≤ 1 MW)
  • DG

connected to MV

  • r

LV networks (rated power > 1 MW)

  • Trader (for MV and LV final customers)

DSO

System resources (ASM) System resources (ASM_D) Local resources (ASM_D or fixed price)

  • TSO: accepts bids/offers from conventional plants or DSOs in order to operate the power system:

(solve residual congestions and create secondary and tertiary reserve at minimum costs)  central dispatch.

  • DSO:
  • enters into purchase and sale contracts for the tradable resources by DG (like PV plants)

(ASM_D, Ancillary Service Market for Distribution network) and provides system resources to the TSO;

  • procures the resources necessary to operate the distribution networks, while respecting all constraints

(ASM_D or fixed price)

  • Conventional plants connected to EHV/HV networks
  • RES connected to EHV/HV networks
  • Final customers connected to EHV/HV networks

22

slide-23
SLIDE 23
  • M. Delfanti – Stockholm, 18 March 2015

THANKS!

Maurizio Delfanti Department of Energy - Politecnico di Milano

maurizio.delfanti@polimi.it

http://www.energia.polimi.it

23