
SLIDE 1
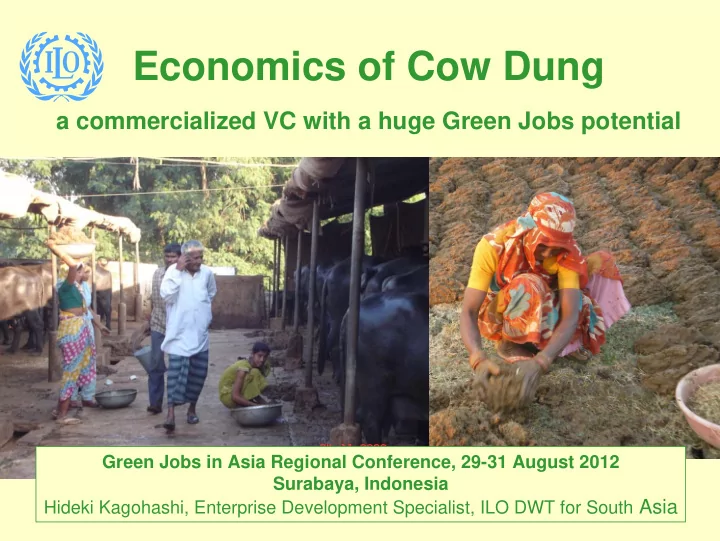
Economics of Cow Dung
a commercialized VC with a huge Green Jobs potential
Green Jobs in Asia Regional Conference, 29-31 August 2012 Surabaya, Indonesia Hideki Kagohashi, Enterprise Development Specialist, ILO DWT for South Asia
Economics of Cow Dung a commercialized VC with a huge Green Jobs - - PowerPoint PPT Presentation
Economics of Cow Dung a commercialized VC with a huge Green Jobs potential Green Jobs in Asia Regional Conference, 29-31 August 2012 Surabaya, Indonesia Hideki Kagohashi, Enterprise Development Specialist, ILO DWT for South Asia Presentation
Green Jobs in Asia Regional Conference, 29-31 August 2012 Surabaya, Indonesia Hideki Kagohashi, Enterprise Development Specialist, ILO DWT for South Asia
2
3
4
Source) REN21 (2012) with inputs from the IRENA and the ILO Green Jobs Programme
5
6
7
8
9
Source) ILO (forthcoming) Economics of Cow Dung
Sell to brick kilns Dung clearn up and collection Dung cake making Contract with dairy farms Lease his land to a middleman Hire labour
11
Contractors lease their
for dung cake making Individuals without extra plots of land use road side for dung cake making
13
Source) ILO estimates
14
Source) ILO estimates
15
16
17
100% dung clean up and collection X Dung cake making Biogas electricity generator ALMP Formalization
OSH guidelines Analysis & dialogue to adjust energy pricing policies Vermin compost making Growing market of
Sell electricity to grid Milk processing & chilling
18
19
Source) ILO calculation
20
Source) ILO calculation
21
22
Start
work shop Res ults Wor ksho p Interview s Focus group discussions Pres enta tion Build
Hyp
sis Wor ksho p Imple- mentatio n 8 - 12 weeks 4 - 6 weeks 1 2 3 4 5 6 Modules
23
24
Small farmer <50 cattle Medium farmer 50‐500 cattel Large farms >500 Milk Dung Milk vendors Outlet shops Cooperatives Priavte Daries Small (2m3) medium (100kW) & large (1MW) biogas plant
Natural resources (Water, Energy, Hay, Healthy Ecosystem, Cultural Value)
Dumped & washed away Dung cake contractors Vermin compost makers Lost Economic activity (waste & pollution) IMPACT ON Economic activity (Elect.Fuel, Water, Fodder) USE OF Ministry of Energy Ministry of Dairy Ministry of Environment Milk policy Renewable Energy policy
Banks, Business service providers
Market demand for Milk, Energy & Fertilizer Unions and Employers Organizations
People and Employment, Values and Norms
25
26
Source) REN21 (2012)
27
Source) REN21 (2012)
28
Source) REN21 (2012)
29
30
31
32
33
34
Source) REN21 (2012)
35
36
37
38
39