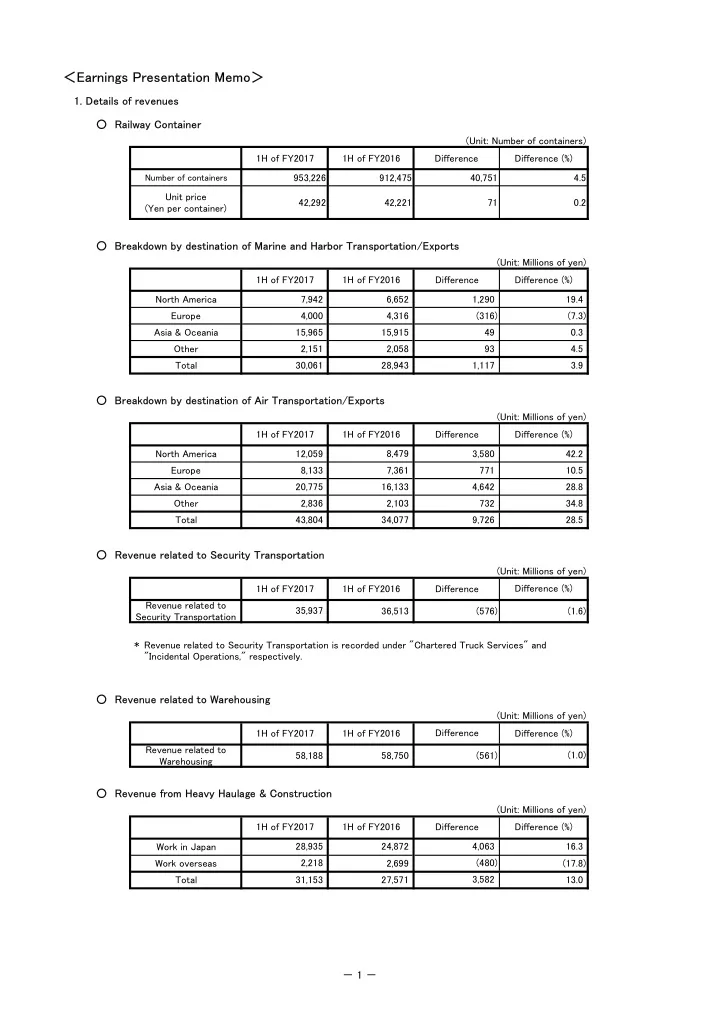
SLIDE 1 <Earnings Presentation Memo>
○ Railway Container ○ Breakdown by destination of Marine and Harbor Transportation/Exports ○ Breakdown by destination of Air Transportation/Exports ○ Revenue related to Security Transportation
*
○ Revenue related to Warehousing ○ Revenue from Heavy Haulage & Construction
Difference Difference (%) 16.3 4,063 28,935 24,872 1H of FY2017 1H of FY2016 Difference 2,218 35,937 (1.0) (480) 3,582 Difference (%) Revenue related to Warehousing 58,188 58,750 (561) (1.6) Difference (%) 36,513 3,580 (576) (17.8) 13.0 2,699 20,775 16,133 4,642 1H of FY2016 North America Difference (%) 10.5 42.2 Europe 12,059 (Unit: Millions of yen) 4,000 7,942 4,316 6,652 Difference (316) 71 42,221 Difference Difference (%) 4.5 912,475 1H of FY2016 40,751 0.2 Unit price (Yen per container) 42,292
Number of containers
1H of FY2017 953,226 2,058 Europe North America Asia & Oceania 1H of FY2017 1H of FY2016 15,965 15,915 4.5 1,117 Total Other 2,151 93 30,061 28,943 Difference 49 1,290 19.4 (7.3) 0.3 Difference (%) 3.9 771 Other 8,133 1H of FY2017 Work in Japan 2,836 2,103 1H of FY2017 1H of FY2016 43,804 34,077 1H of FY2017 1H of FY2016 (Unit: Number of containers) Revenue related to Security Transportation is recorded under "Chartered Truck Services" and "Incidental Operations," respectively. Total 31,153 27,571 Difference Total Work overseas Asia & Oceania 28.5 Revenue related to Security Transportation (Unit: Millions of yen) (Unit: Millions of yen) (Unit: Millions of yen) (Unit: Millions of yen) 28.8 34.8 732 7,361 9,726 8,479
- 1 -
SLIDE 2
- 2. Details of operating expenses
○ Employment costs ○ Railway forwarding costs ○ Marine forwarding costs ○ Air forwarding costs ○ Vehicle chartering and subcontracting costs
Worker dispatching costs 1H of FY2016 121,643 Difference 4.6 Difference (%) 4,025 4.4 Difference Difference (%) 213,045 128,409 5,191 1H of FY2017 1H of FY2016 36,342 34,905 20,455 1H of FY2017 16,413 (482) (1,775) 16.8 10,951 2,236 Difference 37.6 1,025 5.0 (1.3) (0.2) (120) (1,675) 3,149 3,511 (10.3) (0.8) (3.2) 583 (1,192) Total 67,105 Other employees Drivers/workers Subtotal Office personnel Other employees 1H of FY2017 Railway forwarding costs 1H of FY2016
(Reference) Marine transportation revenue
Air forwarding costs 1H of FY2017 Marine forwarding costs 22,579 21,481 54,589 4.4 4.9 (1.7) 6,165 (Unit: Millions of yen) (Unit: Millions of yen) 4,527 5,918 5.1 Vehicle chartering costs Subcontracting costs 92,128 115,725 (12.8) 222,324 96,154 56,365 60,111 1H of FY2017 41,603 13,853 Difference (%) 9,279 (664) (362) Difference (%) 68,297
(Reference) Air transportation revenue
19.3 39,772 1,831 Difference 11,932 1H of FY2016 4.1 11,617 1H of FY2016 Difference Difference (%) 56,479 Total
(Reference) Railway utilization transportation revenue
12,515 59,628 126,733 56,599 (Unit: Millions of yen) Nationwide employees 1,437 76,106 65,155 Subtotal Nationwide employees (Unit: Millions of yen) (Unit: Millions of yen)
- 2 -
SLIDE 3
○ Depreciation and amortization ○ Facility usage charges ○ Other
(△2) (△1.5) (544) (14.6) (398) (7.2) (197) (3,733) (5,525) (1,545) (2,381) (199) (194) (4,277) (5,923) (1,458) (2,451) (206) 784 △ 45.9 3.4 166 5,489 5,655 35,663 1H of FY2016 30,758 21,815 6,303 1,687 31,837 1,079 3.0 Total 25,972 Vehicles 1H of FY2017 6,682 1,696 13,830 1,871 Other work-related 5,773 1,917 1,998 25,974 Other operation-related Other Software 5,902 Buildings/land 2,094 Total 2,740 12,366 Buildings/structures (224) Vehicles 1H of FY2017 1,247 2,965 2,874 (7.6) △ 57 1,973 (10.6) 379 (1,463) 6.0 Difference 124 58,187 2.2 128 (Unit: Millions of yen) 4.8 Difference (%) 178 0.5 (45) Difference (%) (56.6) (1,626) Difference (%) 3.5 3.6 Difference 96 (2.4) (1) (0.0) 8 0.5 1H of FY2016 Difference 1H of FY2016 (Unit: Millions of yen) 1H of FY2017 35,841 60,161 (Merchandise) Taxes Other operating expenses (Fuel oil costs) Other work expenses Total (Fuel oil costs) (Advertising expenses) (Repair expenses) Bad debts written off 67 (Office outsourcing costs) 22,600 (Unit: Millions of yen) (△86) (△5.6) (69) (2.9) (6) (3.3)
- 3 -
SLIDE 4
(Reference) Breakdown of fuel oil costs 〇 Consolidated
Total * Above figures do not include figures from overseas consolidated subsidiaries.
〇 Non-consolidated
* Above figures are recorded under "Other work expenses" and "Other operating expenses" in "Other" on the previous page. (5.1) 10.08 8.62 27.3 0.3 218 (78) 14.0 551 8.54 (1.3) (0.3) 4.7 12.7 9.1 13.6 (398) 13 (453) 10.35 10 Difference (%) (1,490) 11.3 955 (1.0) 24.8 2.9 7,513 350 16 32.70 1,275 10.33 (247) 1,027 (Impact on unit price) (Impact on unit price) 328 26.1 38,996 4,384 110.23 13.6 (2.1) 71,319 721 41 483 75.79 608 (5.6) 9.0 9.95 316 5,405 Difference 1H of FY2016 Usage 4,136 Amount Usage Difference Difference (%) 12.1 34,861 34,408 86.12 6,013 2,982 1H of FY2016 1H of FY2017 3.5 (143) 26.9 41.24 305 2,660 321 2,775 316 76.33 Unit price Gasoline 69,829 497 Unit price 120.18 Amount Gasoline Amount Light oil Usage Amount 366 1H of FY2017 Other 40.17 Unit price Usage Unit price Amount 86.68 Light oil Usage Unit price Heavy oil for vessels 2,633 120.28 Heavy oil for vessels Amount Amount 8,469 38,597 1,591 Total Unit price 4,483 809 Usage Total 156 25,586 Other Amount 25,664 31.55 3,932 110.20 156 356 220 26 1,091 603 (Unit: Millions of yen, ㎘, yen/ℓ) (Unit: Millions of yen, ㎘, yen/ℓ)
- 4 -
SLIDE 5
(Reference) Balance of interest-bearing liabilities 〇 Consolidated 〇 Non-consolidated
488,901 165,000 9,123 9,009 As of Sep. 30, 2016 28,510 As of Sep. 30, 2016 165,000 Total Total Deposits from employees Employees' housing savings deposits Bonds payable Loans payable Lease obligations 8,578 Lease obligations Loans payable 28,672 159,670 Bonds payable 145,000 145,000 As of Sep. 30, 2017 As of Sep. 30, 2017 28,938 433,740 4,253 255,548 160,069 448,103 As of Mar. 31, 2017 145,000 (Unit: Millions of yen) 4,121 As of Mar. 31, 2017 28,339 145,000 (Unit: Millions of yen) 270,330 291,268 166,550 28,241 4,432 28,067 341,921 342,260 368,802
- 5 -
SLIDE 6
(Reference) Changes in number of employees at the end of the period 〇 Consolidated
* Employees engaged in the administration of the Company and group companies
〇 Non-consolidated
1.1 9 Difference (46) 15,426 As of Sep. 30, 2016 (70) (0.4) Drivers/workers Nationwide employees Difference (compared with Sep. 30, 2016) 642 16,212 Subtotal 17,126 Difference (%) Other employees As of Sep. 30, 2017 As of Mar. 31, 2017 16,565 Office personnel 10,983 Other employees 4,446 Nationwide employees 631 15,429 15,154 (107) 3 16,495 16,854 4,278 4,336 110 11,090 810 822 (0.3) 10,876 Subtotal As of Sep. 30, 2017 As of Mar. 31, 2017 As of Sep. 30, 2016 (113) 32,008 32,668 Logistics
South Asia & Oceania
4,827 4,970 4,995 2,773 Total 32,555 (68) (1.7) 70,364 91 Heavy Haulage & Construction Logistics Support 3,996 3,953 4,064 831 Adjustment * 101 Total 69,968 69,673 11.0 96 10 (396) (0.6) (0.7) 677 (1.6) Difference (compared with Sep. 30, 2016) (684) 17,242 (116) 0.0 (1.0) 2.5 (6.8) Difference Difference (%) 4,867 4,449 4,528 339 2.1 6,974 7,136 7.5 (3.4) East Asia 8.7 224 2,578 Security Transportation 7,088 (114) (1.6) 43,481 2,718 2,717 Europe The Americas (168) (Unit: Persons) Japan 56 (Unit: Persons) 2,691 2,802 42,797 42,850
- 6 -
SLIDE 7
(Reference) Capital expenditures 〇 Non-consolidated 〇 Consolidated
* Leased assets include assets leased to Nippon Express Group consolidated subsidiaries. 2,344 1,187 20.4 5,300 50.7 8,500 19,000 Difference Difference (%) Annual plan (70.0) (10,009) Land 1,238 1,028 209 Conducted in 1H of FY2017 Conducted in 1H of FY2016 Buildings Vehicles 3,532 4,299 14,309 378 35.0 2,027 1,649 22.9 10,000 Other 3,777 3,563 214 6.0 7,200 Software 50,000 Total 14,875 22,894 (8,019) Conducted in 1H of FY2017 Conducted in 1H of FY2016 Annual plan Vehicles 6,064 4,141 1,923 49.9 29,000 50.3 90,000 21.0 29,000 Difference Difference (%) Other 11,095 424.4 10,000 (22.5) 6,000 Land 8,764 1,671 7,093 46.5 16,000 9,166 1,928 4,605 (1,034) Leased assets 3,571 Buildings 24,083 16,071 8,012 Total 53,579 35,656 17,923 (Unit: Millions of yen) (Unit: Millions of yen) This document is not aimed to solicit or gain investments in any of our securities that are to be issued. This document is provided only for reference purposes for investors in view of continuous and fair disclosure, and is not a statutory document which is announced/disclosed upon detailed audits, etc. We do not bear any responsibility for any damages caused by information contained in this document.
- 7 -