SLIDE 1 <Earnings Presentation Memo>
- 1. Details of revenues(Non-consolidated)
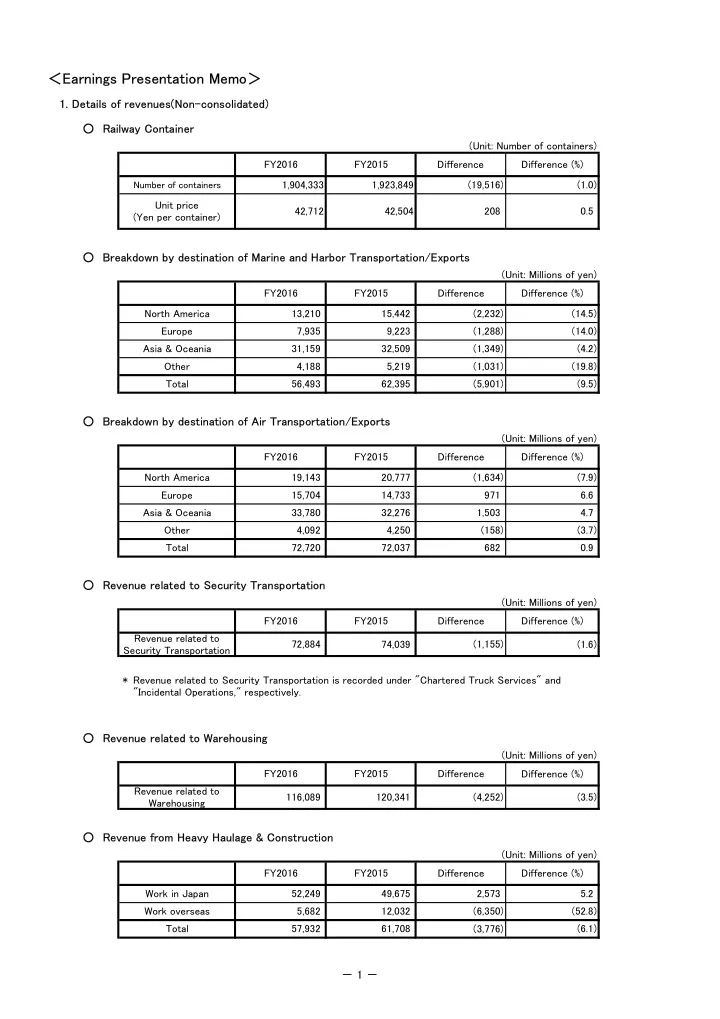
○ Railway Container ○ Breakdown by destination of Marine and Harbor Transportation/Exports ○ Breakdown by destination of Air Transportation/Exports ○ Revenue related to Security Transportation
*
○ Revenue related to Warehousing ○ Revenue from Heavy Haulage & Construction
(3.7) (158) 682 72,037 (3.5) Difference (%) 5.2 12,032 Asia & Oceania 0.9 Total 4,092 4,250 FY2016 FY2015 4.7 (Unit: Number of containers) Revenue related to Security Transportation is recorded under "Chartered Truck Services" and "Incidental Operations," respectively. Total 57,932 61,708 Difference 72,720 (Unit: Millions of yen) (Unit: Millions of yen) (9.5) 971 32,276 1,503 FY2015 Difference (%) 6.6 (7.9) (Unit: Millions of yen) 14,733 FY2016 FY2015 Work overseas 72,884 52,249 49,675 (4.2) Difference (%) Other 15,704 FY2016 Work in Japan 33,780 North America Europe 19,143 62,395 Difference (1,349) (2,232) (14.5) (14.0) 31,159 32,509 (19.8) (5,901) Total Other 4,188 (1,031) 56,493 Unit price (Yen per container) 42,712 5,219 Europe North America Asia & Oceania Difference Difference (%) (1.0)
Number of containers
FY2016 1,904,333 FY2015 (19,516) 0.5 208 42,504 1,923,849 (Unit: Millions of yen) 7,935 13,210 9,223 15,442 Difference (1,288) FY2016 FY2015 20,777 (1,634) (1,155) (52.8) (6.1) Difference (%) Revenue related to Warehousing 116,089 120,341 (4,252) (1.6) Difference (%) Revenue related to Security Transportation 74,039 (6,350) (3,776) Difference 5,682 2,573 (Unit: Millions of yen) FY2016 FY2015 Difference
- 1 -
SLIDE 2
- 2. Details of operating expenses(Non-consolidated)
○ Employment costs ○ Railway forwarding costs ○ Marine forwarding costs ○ Air forwarding costs ○ Vehicle chartering and subcontracting costs
Nationwide employees (Unit: Millions of yen) (Unit: Millions of yen) (5,929) Nationwide employees (Unit: Millions of yen) Total
(Reference) Railway utilization transportation revenue
24,058 119,911 256,502 112,456 FY2015 (8.0) 27,263 Subtotal 134,507 (13.0) 84,827 (810) Difference 22,524
(Reference) Air transportation revenue
Difference (%) Difference (%) Difference (%) 1.0 1,595 403 548 (3.5) 111,982 119,508 FY2016 FY2015 (246) 113,107 (Unit: Millions of yen) (647) (1.5) 42,993
(Reference) Marine transportation revenue
Air forwarding costs FY2016 Difference FY2015 Subcontracting costs 186,164 245,439 434,910 187,732 11,568 9,920 Vehicle chartering costs 16.6 (9,829) (4.0) (1.5) (6,613) 1,647 Marine forwarding costs 36,831 FY2016 7,051 67,769 73,698 43,640 Total 136,590 Other employees Drivers/workers Subtotal Office personnel Other employees Railway forwarding costs 6,804 0.3 0.5 1,534 6.8 254,015 FY2016 FY2015 (Unit: Millions of yen) 112,531 (3,534) Difference (5.6) 0.6 650 2,487 2,083 1.5 (2,204) Difference FY2016 39,035 23,728 84,016 136,208 134,613 (1.0) Difference (%) 1,568 0.8 Difference Difference (%) 441,524 1.2 Worker dispatching costs FY2015 235,610
- 2 -
SLIDE 3
○ Depreciation and amortization ○ Facility usage charges ○ Other
[ ] [ ] [ ] [ ] [ ] [ ] [ ] [ ] [ ] [ ] [ ] [ ] [ ] [ ] [ ] [ ]
(Reference) Balance of interest-bearing liabilities 〇 Consolidated
(9.4) (1.3) (14.8) (Unit: Millions of yen) 448,103 420,271 3,987 28,036 303,246 As of Mar. 31, 2016 85,000 (Unit: Millions of yen) As of Mar. 31, 2017 145,000 28,339 270,330 Bonds payable Lease obligations 8,021 Bad debts written off 117 44,342 Total Other work expenses Total Deposits from employees Other operating expenses (Fuel oil costs) 11,225 Taxes 4,432 FY2016 71,597 118,143 FY2015 (Unit: Millions of yen) FY2015 (400) (0.8) (500) (13.6) Difference (%) 3.0 196 Difference (%) Difference (75) (6.2) (0.1) (844) (9.5) (2.0) (56) Difference (36) (0.2) (22) (Unit: Millions of yen) (0.9) Difference (%) (534) (0.7) Difference ― 121,022 117 (2,878) 8,866 (2.0) (28) (595) (0.2) (4.1) 6,437 6,530 Buildings/structures (262) Vehicles FY2016 6,726 Other Software 11,716 Buildings/land 4,170 Total 6,175 28,932 3,813 Other work-related 11,739 3,889 4,206 52,296 Other operation-related 12,860 3,169 12,888 3,670 Total 51,896 Vehicles FY2016 29,527 62,458 (4,160) 12.2 72,132 FY2015 66,619 44,398 1,220 10,004 ― (2.4) (Fuel oil costs) 405 447 (42) Loans payable (Travel costs) 5,848 5,923 (74) (R&D costs) 311 366 (54)
- 3 -
SLIDE 4
(Reference) Breakdown of fuel oil costs 〇 Non-consolidated
Total * Above figures are recorded under "Other work expenses" and "Other operating expenses" in "Other" on the previous page.
〇 Consolidated
Total * Above figures do not include figures from overseas consolidated subsidiaries. (Unit: Millions of yen, ㎘, yen/ℓ) (Unit: Millions of yen, ㎘, yen/ℓ) (731) (1,345) (779) (508) (58) 42.52 (946) 18,041 120.54 845 12,524 85.26 146,908 84,161 1,821 Total 16,221 Usage Total 806 79,115 Other Amount 79.87 Light oil Usage Unit price Heavy oil for vessels Amount 36.10 Unit price Usage Heavy oil for vessels 8,619 113.79 Amount 8,426 52,101 Other Usage Unit price Unit price Amount Gasoline Amount Light oil Usage Unit price 113.71 Amount 9,067 980 2,856 (10.3) (447) (20.2) 1,092 3,578 11,578 34.96 310 FY2016 Amount 144,962 Unit price 70,656 617 Usage 80.34 5,676 Gasoline 5,433 Amount FY2015 Difference Difference (%) (331) 6,117 Difference FY2015 (440) (369) (35) 679 85.57 (6.1) (1.2) 71,487 (Impact on unit price) (Impact on unit price) (325) (15.2) 52,263 5,645 120.31 (162) (3.8) FY2016 9,313 363 (52) 41.21 2,153 (5.23) (212) (6.75) (61) (1,946) (5.39) (112) Difference (%) (831) (7.2) (6.0) (14.5) (9.5) (5.6) (6.3) (4.9) (7.6) (10.1) (1,820) (39) (6.25) (1.3) (4.7) (722) (5,046) (0.3) (15.4) (9.0) (6.42) (15.1) (5.5) (6.60) (886) This document is not aimed to solicit or gain investments in any of our securities that are to be issued. This document is provided only for reference purposes for investors in view of continuous and fair disclosure, and is not a statutory document which is announced/disclosed upon detailed audits, etc. We do not bear any responsibility for any damages caused by information contained in this document.
- 4 -