
SLIDE 1 Review
- f
Hi Hi
E E
(h)
- ut
in(h)
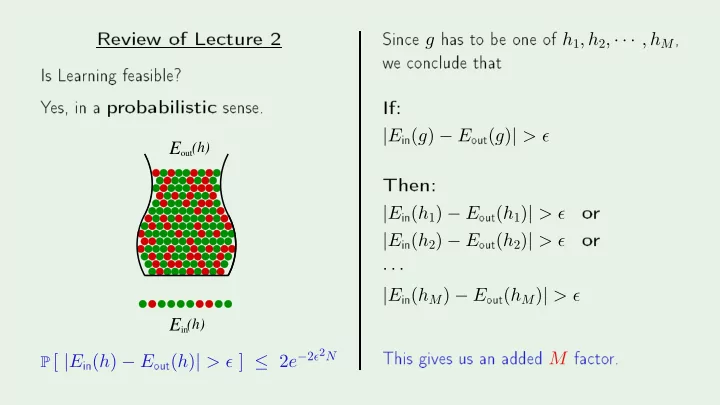
P [ |E
in(h) − E- ut(h)| > ǫ ] ≤ 2e−2ǫ2N
- ne
- f h1, h2, · · · , hM
- n lude
|E
in(g) − E- ut(g)| > ǫ
|E
in(h1) − E- ut(h1)| > ǫ
- r
|E
in(h2) − E- ut(h2)| > ǫ
- r
· · · |E
in(hM) − E- ut(hM)| > ǫ