
SLIDE 1
Dyno Test results of a Cat 3408 A Brief Overview in Association with - - PowerPoint PPT Presentation
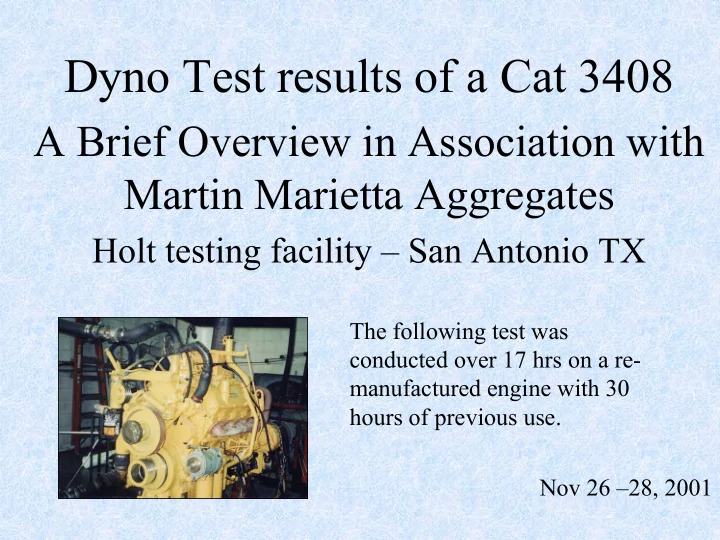
Dyno Test results of a Cat 3408 A Brief Overview in Association with Martin Marietta Aggregates Holt testing facility San Antonio TX The following test was conducted over 17 hrs on a re- manufactured engine with 30 hours of previous use.
Exhaust Valve Opens
Chained Hydrocarbons Ignite and Burn Un-Chained Hydrocarbons Smolder (Partial Combustion) Any Combustion After This Point Is Wasted Heat (Energy)!
After combustion, as the cylinder cools off, the un-used hydrocarbons smolder and energy is wasted in the exhaust.
Exhaust Valve Opens
Chained Hydrocarbons Ignite and Burn Un-Chained Hydrocarbons Smolder (Partial Combustion)
With the addition of the catalyst, the fuel can now use the oxygen more efficiently inside the engine, and is able to burn down to a lower temperature, this means the energy is used inside the engine rather than the exhaust. With less wasted energy, the exhaust temperature is
45º F less @ 50% Load 119º F less @ 85% Load
If the fuel is burning more completely, then the emissions must be reduced.
Opacity
(Static test – Load n/a) The black smoke is reduced Carbon Monoxide
The conversion of CO is improved Hydrocarbons
Less un-used hydrocarbons are present in the exhaust due to improved combustion Nox +16% (50% load) +29% (85% load) The Nox levels may increase during the initial ‘clean out’ period, while the soft and hard carbon deposits oxidize. 17 hours was not enough time for the Rhodium levels to build up.
Note: These values do not even include additional reductions in overall pollutants resulting from the un-used fuel. If the fuel wasn’t used in the first place, it never had a chance to turn into pollution. This translates into even greater overall pollution reductions.
HOLT - 3408 Cat 3408 Cat -ET Engine Torsional Vibration Label: 85% Load - Without ET Route Spectrum 27-Nov-01 00:54:26 OVERALL= .1099 G-DG RMS = .1093 LOAD = 100.0 RPM = 2055. RPS = 34.25 1 2 3 4 5 6 7 8 0.02 0.04 0.06 0.08 0.10 Frequency in Orders
RMS Amplitude in +/- Deg .50 1.00 1.50 2.00 2.50 3.00 3.50 4.00 4.50 5.00 5.50
HOLT - 3408 Cat 3408 Cat -ET Engine Torsional Vibration Route Spectrum 28-Nov-01 08:54:01 OVERALL= .1022 G-DG RMS = .1018 LOAD = 100.0 RPM = 2115. RPS = 35.26 1 2 3 4 5 6 7 8 0.02 0.04 0.06 0.08 0.10 Frequency in Orders
RMS Amplitude in +/- Deg .50 1.00 1.50 2.00 2.50 3.00 3.50 4.00 4.50 5.00 5.50
*The number 1.00 harmonic revolution is removed due to excessive background interference
HOLT - 3408 Cat 3408 Cat -SS1 SonicScan #1 Cylinder (43 kHz) Label: 85% Load - without ET Route Waveform 27-Nov-01 00:55:17 RMS = 6.64 LOAD = 100.0 RPM = 2073. RPS = 34.55 PK(+) = 21.42 PK(-) = 17.37 CRESTF= 3.23 0.5 1.0 1.5 2.0
10 20 30 Time in Seconds
Amplitude in STANDARD
HOLT - 3408 Cat 3408 Cat -SS1 SonicScan #1 Cylinder (43 kHz) Route Waveform 27-Nov-01 17:20:10 RMS = 7.10 LOAD = 100.0 RPM = 2116. RPS = 35.26 PK(+) = 26.33 PK(-) = 19.28 CRESTF= 3.71 0.5 1.0 1.5 2.0
10 20 30 Time in Seconds
Amplitude in STANDARD
* - Averaged over cylinders 1,3,5,7