
SLIDE 1
www.jacobs.com | worldwide
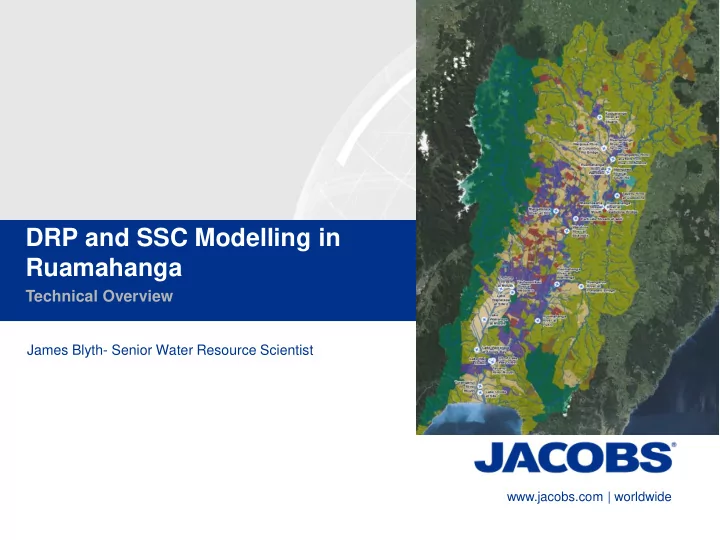
DRP and SSC Modelling in Ruamahanga
Technical Overview
James Blyth- Senior Water Resource Scientist
DRP and SSC Modelling in Ruamahanga Technical Overview James - - PowerPoint PPT Presentation
DRP and SSC Modelling in Ruamahanga Technical Overview James Blyth- Senior Water Resource Scientist www.jacobs.com | worldwide What should you consider from the modelling results? These are a guide to help inform your decisions The
www.jacobs.com | worldwide
James Blyth- Senior Water Resource Scientist
2
3
4
5
6
7
8
https://www.niwa.co.nz/environmental-information/update/environmental-information-update-3-august-2012/monitoring-suspended-sediment-to-better
9
10
11
12
80 80 80 80
6.40 20.70 0.00 5.80
13
14
15
16
17
18
This presentation has been prepared by Jacobs for Greater Wellington Regional Council (the Client) for the purposes
for, or in respect of, any use of, or reliance upon, this presentation (or any part of it) for any other purpose. In preparing this presentation, Jacobs has relied upon, and presumed accurate, any information (or confirmation of the absence thereof) provided by the Client and/or others sources of external model inputs such as from Geological Nuclear Science (GNS) or National Institute of Water and Atmospheric Research (NIWA). If the information is subsequently determined to be false, inaccurate or incomplete then it is possible that our observations and conclusions as expressed in this presentation may change. Jacobs derived the data in this presentation from information sourced from the Client (if any) and/or available in the public domain at the time or times outlined in this
examination of the project and subsequent data analysis, and re-evaluation of the data, findings, observations and conclusions expressed in this presentation. Jacobs has prepared this presentation in accordance with the usual care and thoroughness of the consulting profession, for the sole purpose described above and by reference to applicable standards, guidelines, procedures and practices at the date of issue of this presentation. For the reasons outlined above, however, no other warranty or guarantee, whether expressed or implied, is made as to the data, observations and findings expressed in this presentation, to the extent permitted by law. This presentation may also describe specific limitations and/or uncertainties which qualify its findings. Accordingly, this presentation should be read in full and no excerpts are to be taken as representative of the findings unless any such excerpt and the context in which it is intended to be used have been approved by Jacobs in writing.