
SLIDE 1
1
DQ 2015 Results Presentation January 15, 2016 1 Safe Harbor - - PowerPoint PPT Presentation
DQ 2015 Results Presentation January 15, 2016 1 Safe Harbor Statement This Release / Communication, except for the historical information, may contain statements, including the words or phrases such as expects, anticipates, intends, will,
1
2
This Release / Communication, except for the historical information, may contain statements, including the words or phrases such as ‘expects, anticipates, intends, will, would, undertakes, aims, estimates, contemplates, seeks to, objective, goal, projects, should’ and similar expressions or variations of these expressions or negatives of these terms indicating future performance or results, financial or otherwise, which are forward looking statements. These forward looking statements are based on certain expectations, assumptions, anticipated developments and other factors which are not limited to, risk and uncertainties regarding fluctuations in earnings, market growth, intense competition and the pricing environment in the market, consumption level, ability to maintain and manage key customer relationship and supply chain sources and those factors which may affect our ability to implement business strategies successfully, namely changes in regulatory environments, political instability, change in international oil prices and input costs and new or changed priorities of the trade. The Company, therefore, cannot guarantee that the forward looking statements made herein shall be realized. The Company, based on changes as stated above, may alter, amend, modify or make necessary corrective changes in any manner to any such forward looking statement contained herein or make written or oral forward looking statements as may be required from time to time on the basis of subsequent developments and events. The Company does not undertake any obligation to update forward looking statements that may be made from time to time by or on behalf of the Company to reflect the events or circumstances after the date hereof.
3
4
Consistent Growth Competitive Growth Profitable Growth Responsible Growth Strategic Framework Sustainable Living Plan Goals
5
Market growth moderates on Rural slow down Growth continues to be led by volumes Commodity costs soften further Competitive activity remains high
6 Source: Bloomberg data and internal estimates INR numbers arrived at by applying the average exchange rate of the quarter to the average USD cost of the commodity
Exchange Rate PFAD Brent Crude
INR / USD
62.0 63.8 66.2 65.9 DQ'14 JQ'15 SQ'15 DQ'15 $618 $652 $482 $432 38.3 41.6 31.9 28.5 DQ'14 JQ'15 SQ'15 DQ'15 $/ Ton INR/ Kgs $76 $62 $50 $44 4.7 4.0 3.3 2.9 DQ'14 JQ'15 SQ'15 DQ'15 $/ Barrel INR(000)/ Barrel
7
Domestic Consumer business = Domestic FMCG + Water; COGS – Cost of Goods Sold; A&P - Advertising & Promotion;
Reported Domestic Consumer growth at 3%, underlying volume growth at 6%
Operating Profit (PBIT) at Rs.1349 crores, up 7%; margin expands +60 bps
PAT (bei) at Rs. 1024 crores, up 7%, Net Profit at Rs. 971 crores
8
Sales growth = Segment Turnover growth excluding Other Operational Income
and one-time realignment of channel spends
Segments Reported Sales Growth (%) Growth before impact of phase out of Excise Duty benefits (%) Soaps and Detergents 1 2 Personal Products 5 7 Beverages 7 7 Packaged Foods 12 12 Domestic Consumer 3 4
10
11
Pond’s Dilwale Tie up Haath Muh aur Bum Bimaari Hogi Kam Lifebuoy Help a child reach 5 Lakme Bang Baaja Baraat Cornetto Durga Puja activity Bru Meet and Greet Activity
12
13
Dove, Pears and Lifebuoy deliver strong volume growth Liquids clock another quarter of double digit growth Continued price deflation due to benign commodity costs Phase out of Excise Duty benefit impacts growth
14
Laundry
Household Care
Continued price deflation due to benign commodity costs Phase out of Excise Duty benefit impacts growth
15
Growth impacted by delayed winter and one-time realignment
FAL continues to do well; good response on BB Cream Pond’s driven by premium skin lightening Lakme led by premium innovations; strong delivery on CC Cream
FAL = Fair and Lovely
16
Volume led double digit growth* Dove leads category performance TRESemmé gains further ground Conditioners grow well on focused market development
*Before impact of phase out of Excise Duty benefits
17
Close Up growth continues to be led by impactful activation Pepsodent performance muted; Clove & Salt doing well Actions underway to revive growth and competitiveness
18
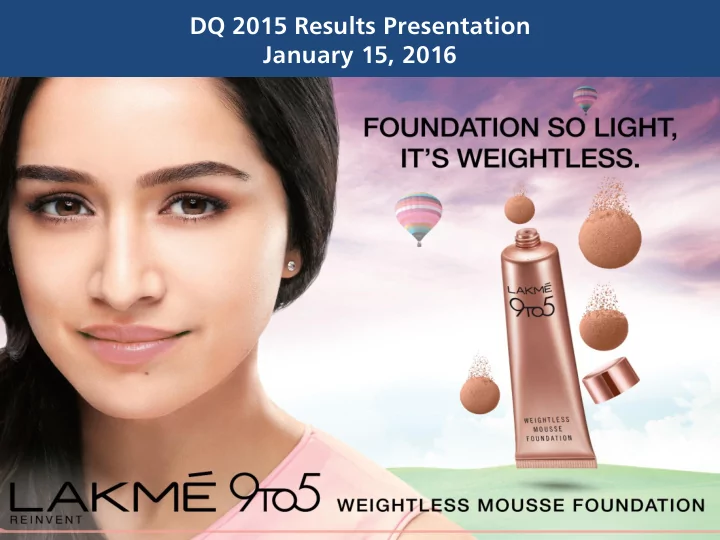
Lakme delivers another quarter of double digit growth
19
Tea delivers broad based volume led growth driven by impactful activation and market development
Bru Coffee registers double digit growth and achieves market leadership
20
Focus on market development continues Double digit growth in Kissan, Knorr and Kwality Walls
execution focused around Kwality Walls and Magnum
21
Portfolio strategy being refreshed to play in the wider market
Focus remains on building relevance and accessibility E-commerce channel continues to grow rapidly
22
Particulars DQ'14 DQ'15 Growth % Net Sales* 7,579 7,823 3 PBIT 1,258 1,349 7 PBIT margin (%) 16.6 17.2 60 bps
Rs Crores
23
Rs Crores
Particulars DQ’14 DQ’15 Growth % PBIT 1258 1349 7 Add : Other Income 120 140 16 Less : Finance Costs 4 Exceptional Items – Credit / (Charge) 397
PBT 1771 1409
Less : Tax (519) (437) Net Profit 1252 971
24
26
Particulars YTD DQ‘14 YTD DQ‘15 Growth % Net Sales 22,616 23,616 4 PBIT 3,674 4,030 10 PBIT margin (%) 16.3 17.1 80 bps Exceptional Items – Credit / (Charge) 485
PAT bei 2,932 3047 4 Net Profit 3,297 2993
Rs Crores
27
28
BACKGROUND
SCOPE
Profit & Loss Account NEXT STEPS
as per the terms of the Scheme
29