
SLIDE 1
Quarterly presentation Q1 2016
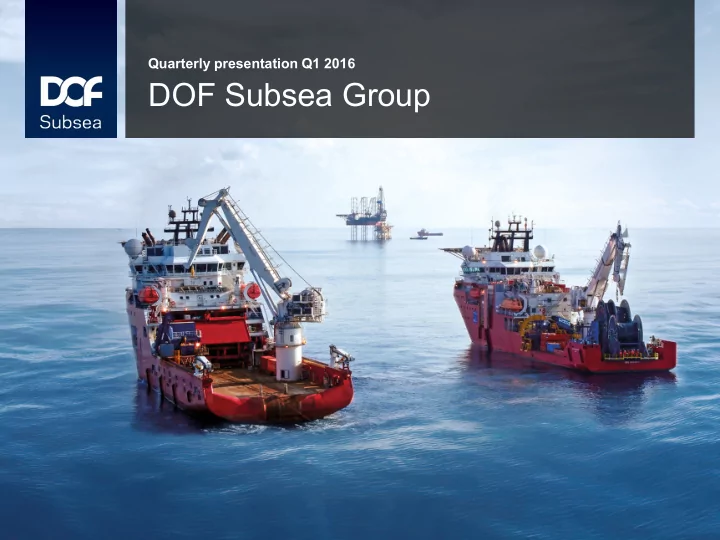
DOF Subsea Group DOF Subsea Group DOF Subsea Group in brief - - PowerPoint PPT Presentation
Quarterly presentation Q1 2016 DOF Subsea Group DOF Subsea Group DOF Subsea Group in brief Fleet One of the largest subsea vessel owners in the world Owns and operates a fleet of 21 vessels, plus 4 newbuilds on order
Quarterly presentation Q1 2016
adjusted age of approx. 5.9 years
Brazil
1 468
898
Norway Brazil Canada US UK Asia Pacific Angola
290 360 54 202 195 352 15
3
Key figures
Back-log incl. options
Market value of fleet
Condensed figures 5 last quarters
* According to internal Management reporting
4
Skandi Hercules
5
Skandi Açu Build 2016 Design VARD 3 05 Type Subsea / PLSV LOA 146.0 m Breadth 30.0 m Draught 8.5 m DWT 10 800t Accommodation 120 persons TLS tower 650t
6
2005
Established
20 552
NOK million total assets
Modern
high-end fleet and equipment
21
vessels
4
vessels
2
vessels
62 ROVs, 5 ROVs
First Reserve Corporation (49%)
1 468
highly-skilled employees DOF Subsea DOF Subsea Holding
(100%)
DOF ASA
(51%)
7
ATLANTIC NORTH AMERICA BRAZIL ASIA PACIFIC
Macaé Rio de Janeiro Buenos Aires Houston St John’s Aberdeen Bergen Luanda Singapore Manila Melbourne Jakarta Brunei Kuala Lumpur Darwin Perth
360 9 500 8 256 2 352 3 1
8
DOF Subsea fleet evolution
4 000 6 000 8 000 10 000 12 000 14 000 16 000 18 000 4 8 12 16 20 24 28
200520062007200820092010201120122013201420152016
NOK million Number of operated vessels
Owned vessels Chartered vessels MV of owned fleet (r.a.)
MV of fleet
2005 - 2010
Fleet: From 11 to 21 vessels
Stock Exchange in 2005, and taken private by DOF and FRC in 2008
in all major offshore oil & gas regions
Management System, and achieved global ISO certification
2011
Fleet: 24 vessels
Skandi Niteroi
Geosounder
Skandi Constructor
Skandi Skansen
Skandi Singapore
2012
Fleet: 25 vessels
newbuild
newbuild contract
Skandi Hawk
2013
Fleet: 26 vessels
newbuild contract
Harvey Deep-Sea
Geobay
Skandi Bergen
newbuild contracts for 4 x PLSVs
Normand Reach
recertification
2014
Fleet: 28 vessels
Skandi Bergen to new owners
Ross Candies
Chloe Candies
Skandi Skolten to new owners
DOF Subsea employees
200 400 600 800 1 000 1 200 1 400 1 600 1 800 2 000
2005 2006 2007 2008 2009 2010 2011 2012 2013 2014 2015 2016
Number of employees
Employees
2015
Fleet: 24 vessels
Skandi Aker to new
Skandi Africa
Skandi Hawk
Skandi Arctic
Skandi Inspector * As per 31st March 2016
2016
Fleet: 23 vessels
Skandi Protector to new owners
Skandi Açu
9
10
ISO 9001: 2015
OHSAS 18001:2007
ISO 14001:2015
2009
11
1 000 000 2 000 000 3 000 000 4 000 000 5 000 000 6 000 000
4,0 6,0 8,0 10,0 12,0 2005 2006 2007 2008 2009 2010 2011 2012 2013 2014 2015
Man-hours Frequence: Incident / 1 000 000 man-hour
DOF Subsea HSEQ-statistics
LTI TR Man-hours
12
presence over the last 10 years
project business gradually
complexity driving growth
complexity of work done
back-log with focus on IMR
chartered in vessels
* According to internal Management reporting
Operating income by segment
2013 2014 2015 Subsea projects 4 971 5 187 4 810 Chartering of vessels 1 609 2 236 2 442 Total 6 580 7 422 7 252
1 000 2 000 3 000 4 000 5 000 6 000 7 000 8 000 Chartering of vessels Subsea projects
Q1 2014 Q1 2015 Q1 2016 Subsea projects 1 035 1 086 904 Chartering of vessels 496 570 502 Total revenue 1 531 1 656 1 406
200 400 600 800 1 000 1 200 1 400 1 600 1 800 Chartering of vessels Subsea projects
13
* Figures based on remaining back-log from beginning of April 2016
2016 2017 2018 2019 2020 2021 2022 2023 Firm 20 17 15 12 9 7 5 4 Option 18 17 17 16 15 15 14 13
10 15 20 25 30 35 40 NOK billion 14
16
17
* According to internal Management reporting
0% 5% 10% 15% 20% 25% 30% 35% 40%
1 000 1 500 2 000 2 500
Q1 2012 Q2 2012 Q3 2012 Q4 2012 Q1 2013 Q2 2013 Q3 2013 Q4 2013 Q1 2014 Q2 2014 Q3 2014 Q4 2014 Q1 2015 Q2 2015 Q3 2015 Q4 2015 Q1 2016
NOK million Operating income EBITDA EBITDA margin
NOK million
Q1 2012 Q2 2012 Q3 2012 Q4 2012 Q1 2013 Q2 2013 Q3 2013 Q4 2013 Q1 2014 Q2 2014 Q3 2014 Q4 2014 Q1 2015 Q2 2015 Q3 2015 Q4 2015 Q1 2016 Operating income 1 223 1 384 1 354 1 288 1 225 1 679 1 804 1 871 1 530 1 963 1 904 2 025 1 656 1 962 1 991 1 642 1 406 EBITDA 411 470 489 417 329 471 595 550 502 543 552 502 458 515 553 516 456 EBITDA margin 33,6% 34,0% 36,1% 32,4% 26,9% 28,1% 33,0% 29,4% 32,8% 27,7% 29,0% 24,8% 27,7% 26,2% 27,8% 31,4% 32,4% Current assets 2 782 2 962 2 704 2 612 3 077 3 319 3 119 3 470 3 247 3 252 2 998 4 223 3 414 3 414 3 674 3 752 2 900 Non-current assets 16 455 16 230 16 056 16 012 16 043 16 344 16 330 16 340 16 012 16 151 16 215 15 796 16 726 16 578 16 447 16 818 17 652 Total assets 19 238 19 192 18 760 18 624 19 120 19 663 19 450 19 810 19 258 19 403 19 213 20 019 20 140 19 992 20 121 20 570 20 552 Current liabilities 2 543 2 495 2 260 1 989 2 000 2 805 2 808 3 167 3 470 3 741 3 607 4 505 4 139 4 577 4 492 3 650 2 991 Non-current liabilities 11 723 11 735 11 439 11 534 12 051 11 862 11 474 11 427 10 126 9 701 9 668 9 402 9 924 9 009 9 988 11 228 11 482 Equity 4 970 4 963 5 061 5 102 5 069 4 996 5 167 5 216 5 662 5 962 5 938 6 112 6 077 6 405 5 641 5 692 6 078
18
DOFSUB05 (Repaid)
DOFSUB07
amount of restricted cash.
Debt maturity profile DOF Subsea AS level, 2016E – 2020E
1 000 1 500 2 000 2 500 3 000 2016E 2017E 2018E 2019E 2020E 2021E Thereafter Bond Loan Bank Debt Balloons 19
Risk mitigating factors
Global presence provide access to more market
Strong back-log provides stable earnings Diversified blue- chip customers reduce counterparty risk Value added services provide increased earnings potential Modern, high- end fleet provides safe collateral Strong bank and investor relationships provide access to credit Spare leveraging capacity on existing fleet Recent sale of vessels confirm values
Weaker subsea market
20
advanced and flexible vessels and engineering capabilities
sophisticated fleet and has a global
22
Weaker market conditions
Reduced demand Increasing supply
23
Weak subsea market and pressure
Lower IMR activity globally Lower rig activity and delayed field development Reduced E&P spending Low and volatile oil price Number of niche subsea players Improved access to qualified personnel Increased supply of subsea vessels
DOF Subsea has mitigated the weaker fundamentals through a global footprint, a diversified portfolio of clients, strengthened balance sheet and a back-log of NOK 38 billion
24