
SLIDE 1
Q4 2014 Presentation
DOF Subsea Group Agenda In brief Recent events Group overview - - PowerPoint PPT Presentation
Q4 2014 Presentation DOF Subsea Group Agenda In brief Recent events Group overview Projects Contract status Financials Outlook DOF Subsea Group In brief Fleet One of the largest subsea vessel owners in the world Owns
Q4 2014 Presentation
In brief Recent events Group overview Projects Contract status Financials Outlook
DOF Subsea 3
age of approx. 6.2 years
Brazil
1 858
1 390
Norway Brazil Canada US UK Asia Pacific Angola
345 443 53 172 440 388 17
DOF Subsea 4
Back-log incl. options NOK 36 billion Market value of fleet NOK 15 billion Number of shares 119 733 714
Total Per share
Book equity NOK 6.1 billion NOK 51.05 Value adj. equity NOK 9.0 billion NOK 75.17 Book equity ratio 30.5 % Value adj. equity ratio 39.3 %
7.3 % CAGR 17.6 % CAGR
Quarterly figures
* According to internal Management reporting
0% 5% 10% 15% 20% 25% 30% 35%
1 000 1 500 2 000 2 500
Q4 2011 Q4 2012 Q4 2013 Q4 2014
NOK million Operating revenue EBITDA EBITDA margin
DOF Subsea 5
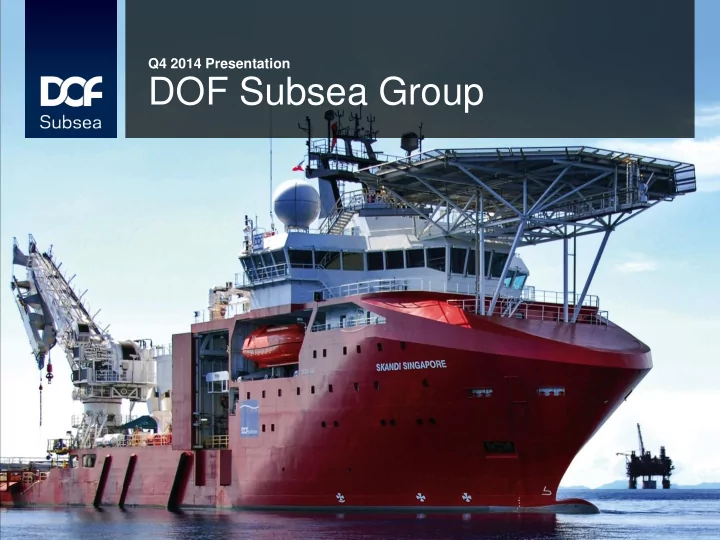
Harvey Deep-Sea, Chloe Candies and Ross Candies
utilizing Skandi Hercules, Skandi Singapore and Skandi Hawk.
DOF Subsea
DOF Subsea 7
51% 49% 100%
DOF ASA FIRST RESERVE CORPORATION DOF SUBSEA HOLDING AS DOF SUBSEA AS
GEOGRAPHICAL FOCUS AREAS
Perth Rio de Janeiro Buenos Aires Singapore Houston
Aberdeen Cairo Brunei Macaé Jakarta Manila Angola Moscow Bergen (225) (443) (17) (388) (785)
8 DOF Subsea Malaysia
9 4 8 5 1
DOF Subsea fleet evolution
4 000 6 000 8 000 10 000 12 000 14 000 16 000 18 000 4 8 12 16 20 24 28
2005 2006 2007 2008 2009 2010 2011 2012 2013 2014
NOK million Number of operated vessels
Owned vessels Chartered vessels MV of owned fleet (r.a.)
MV of fleet
DOF Subsea 9
2005 - 2010
Fleet: From 11 to 21 vessels
Stock Exchange in 2005, and taken private by DOF ASA and FRC in 2008
in all major offshore oil & gas regions
Management System, and achieved global ISO certification
2011
Fleet: 24 vessels
Niteroi
Geosounder
Constructor
Skansen
Singapore
2012
Fleet: 25 vessels
newbuild
newbuild contract
Hawk
2013
Fleet: 26 vessels
newbuild contract
Deep-Sea
Bergen
contracts for 4 x PLSVs
Normand Reach
2014
Fleet: 28 vessels
Bergen to new owners
Candies
Candies
Skolten to new owners
DOF Subsea employees
200 400 600 800 1 000 1 200 1 400 1 600 1 800 2 000
2005 2006 2007 2008 2009 2010 2011 2012 2013 2014
Number of employees
Employees
2015
Fleet: 27 vessels
Aker to new owners
DOF Subsea 10
2,00 3,00 4,00 5,00 6,00 7,00 8,00 9,00 10,00 Average fleet age Value adjusted
Newbuild 18 % 2007 - 2013 56 % 2000 - 2006 22 % Before 2000 4 %
Year of delivery DOF Subsea fleet
ISO 9001: 2008
OHSAS 18001:2007
ISO 14001:2004
DOF Subsea 11
2009
DOF Subsea 12
1 000 000 2 000 000 3 000 000 4 000 000 5 000 000 6 000 000 2 4 6 8 10 12 2005 2006 2007 2008 2009 2010 2011 2012 2013 2014
Man-hours Frequence: Incident / 1 000 000 man-hour
DOF Subsea HSEQ-statistics
LTI TR Man-hours
DOF Subsea
DOF Subsea 14
business gradually
driving growth
in vessels
DOF Subsea 15
* According to internal Management reporting
2012 2013 2014 Subsea projects 3 776 4 971 5 378 Chartering of vessels 1 472 1 609 2 044 Total 5 248 6 580 7 422 1 000 2 000 3 000 4 000 5 000 6 000 7 000 8 000
Operating income by segment
Chartering of vessels Subsea projects Total
Status 2009
Survey specialized region without dedicated vessels
Status today
2 main Business Activities Subsea / S&P ( 85 / 15% revenue allocation) Current staff 202 (149 US / 53 CA) Offshore staff 121 (68 Subsea / 53 S&P) Vessel in operation 4 (3 Jones Act Compliant) ROVs 7 (6 Work class, 1 Obs) Houston facility 105 office space Satellite office
DOF Subsea 16
DOF Subsea
DOF Subsea 18
* Figures on a year-end basis
2015 2016 2017 2018 2019 2020 2021 2022 Firm 18 15 13 11 9 7 5 4 Option 18 18 16 15 14 13 12 11
10 15 20 25 30 35 40 NOK billion
DOF Subsea
DOF Subsea 20 * The financial numbers are presented according to IFRS 11. See DOF Subsea financial report Q4 2014 note 1 and 2 for details.
DOF Subsea 21
DOF Subsea 22
17.0 % CAGR 11.9 % CAGR
* According to internal Management reporting
0% 5% 10% 15% 20% 25% 30% 35% 40%
1 000 1 500 2 000 2 500
Q4 2010 Q1 2011 Q2 2011 Q3 2011 Q4 2011 Q1 2012 Q2 2012 Q3 2012 Q4 2012 Q1 2013 Q2 2013 Q3 2013 Q4 2013 Q1 2014 Q2 2014 Q3 2014 Q4 2014
NOK million Operating income EBITDA EBITDA margin
NOK million
Q4 2010 Q1 2011 Q2 2011 Q3 2011 Q4 2011 Q1 2012 Q2 2012 Q3 2012 Q4 2012 Q1 2013 Q2 2013 Q3 2013 Q4 2013 Q1 2014 Q2 2014 Q3 2014 Q4 2014 Operating income 1 080 900 1 028 1 152 1 246 1 223 1 384 1 354 1 288 1 225 1 679 1 804 1 871 1 530 1 963 1 904 2 025 EBITDA 320 241 325 370 406 411 470 489 417 329 471 595 550 502 543 553 502 EBITDA margin 29.7% 26.8% 31.6% 32.1% 32.6% 33.6% 34.0% 36.1% 32.4% 26.9% 28.1% 33.0% 29.4% 32.8% 27.7% 29.0% 24.8% Current assets 3 366 2 829 3 003 2 938 2 923 2 782 2 962 2 704 2 612 3 077 3 319 3 119 3 470 3 247 3 252 2 998 4 223 Non-current assets 14 179 14 520 15 089 16 178 16 305 16 455 16 230 16 056 16 012 16 043 16 344 16 330 16 340 16 012 16 151 16 215 15 796 Total assets 17 545 17 349 18 092 19 117 19 228 19 238 19 192 18 760 18 624 19 120 19 663 19 450 19 810 19 258 19 403 19 213 20 019 Current liabilities 2 167 2 311 2 458 2 640 2 637 2 543 2 495 2 260 1 989 2 000 2 805 2 808 3 167 3 470 3 741 3 607 4 505 Non-current liabilities 10 154 9 946 10 542 11 694 11 759 11 723 11 735 11 439 11 534 12 051 11 862 11 474 11 427 10 126 9 701 9 668 9 402 Equity 5 224 5 091 5 092 4 782 4 832 4 970 4 963 5 061 5 102 5 069 4 996 5 167 5 216 5 662 5 962 5 938 6 112
DOF Subsea 23
1,00 1,50 2,00 2,50 3,00 2009 2010 2011 2012 2013 2014
Interest Coverage (EBIT / Interest cost)
4,00 6,00 8,00 10,00 12,00 2009 2010 2011 2012 2013 2014
NIBD/EBITDA
0,20 0,30 0,40 0,50 0,60 0,70 0,80 0,90 1,00 2009 2010 2011 2012 2013 2014
NIBD/Total assets
0,20 0,30 0,40 0,50 0,60 0,70 0,80 0,90 1,00 2009 2010 2011 2012 2013 2014
Debt/Total assets
* According to internal Management reporting, including gain on sale of assets
DOF Subsea 24 200 300 400 500 600 700 800 900 2002 2003 2004 2005 2006 2007 2008 2009 2010 2011 2012 2013 2014 NOK million Skandi Seven Ocean Protector Geoholm Skandi Patagonia
Market value development
DOF Subsea 25
DOFSUB06
DOFSUB05
DOFSUB07
amount of restricted cash.
Debt maturity profile DOF Subsea AS level, 2015E – 2019E
1 000 1 500 2 000 2 500 2015E 2016E 2017E 2018E 2019E After Bond Loan Bank Debt Balloons
DOF Subsea 26
be delivered assuming standard DOF Subsea leverage. Bonds not included.
Gearing forecast – summary
Total assets (NOK billion) Market value
Vessels 15.1 Other equipment (a) 1.5
Total assets 16.7
(a) Includes ROVs, AUV, diving systems and other equipment
0 % 10 % 20 % 30 % 40 % 50 % 60 % 70 % 80 % 90 % 100 % 2015E 2016E 2017E 2018E 2019E 43% 43% 40% 36% 26% 57% 57% 60% 64% 74% Loan to value Market Value Cushion
DOF Subsea 27
Improved credit metrics going forward
Extremely strong back-log provides stable earnings Diversified blue- chip customers reduce counterparty risk Value added services provide increased earnings potential New, high-end fleet provides safe collateral Strong bank and investor relationships provide access to credit Spare leveraging capacity on existing fleet Robust liquidity buffer
Challenging subsea market
DOF Subsea
DOF Subsea 29
short term
technologically advanced vessels and engineering capabilities
sophisticated fleet and has a global project
DOF Subsea 30
capabilities
Challenging market conditions
Reduced demand Increasing supply
DOF Subsea 31
Challenging subsea market – pressure on margins
Mixed IRM activity globally Mixed rig activity and delayed field development Reduced E&P spending Lower oil price Number of niche subsea players Improved access to qualified personnel Increased supply of subsea vessels
DOF Subsea has mitigated the increased market risk through a global footprint, a diversified portfolio of clients, strengthened balance sheet and a strong back-log of NOK 36 billion
DOF Subsea 33
This presentation by DOF Subsea AS (“DOF Subsea” or the “Company”) is designed to provide a high level overview of aspects of the
The material set out in the presentation is current as at 31st December 2014. This presentation contains forward looking statements relating to operations of DOF Subsea and the DOF Subsea Group that are based
and “estimates” and similar expressions are intended to identify forward looking statements. References in the presentation to assumptions, estimates and outcomes and forward looking statements about assumptions, estimates and outcomes, which are based on internal business data and external sources, are uncertain given the nature of the industry, business risks, and other factors. Also, they may be affected by internal and external factors that may have a material effect on future business performance and results. No assurance or guarantee is, or should be taken to be, given in relation to the future business performance or results of DOF Subsea or the DOF Subsea Group or the likelihood that the assumptions, estimates or outcomes will be achieved. While management has taken every effort to ensure the accuracy of the material in the presentation, the presentation is provided for information only. DOF Subsea, its officers and management exclude and disclaim any liability in respect of anything done in reliance on the presentation. All forward looking statements made in this presentation are based on information presently available to management and DOF Subsea assumes no obligation to update any forward looking statements. Nothing in this presentation constitutes investment advice and this presentation shall not constitute an offer to sell or the solicitation of any offer to buy any securities or otherwise engage in any investment activity.