diverse energy future UNSW 17 Nov 2016, based on Presentation at - - PowerPoint PPT Presentation

diverse energy future
SMART_READER_LITE
LIVE PREVIEW

diverse energy future UNSW 17 Nov 2016, based on Presentation at - - PowerPoint PPT Presentation

Our efficient, smart, Credit Suisse flexible, distributed and diverse energy future UNSW 17 Nov 2016, based on Presentation at APEC Energy Ministers Meeting 13 October 2015 Alan Pears AM Senior Industry Fellow RMIT University, Melbourne


slide-1
SLIDE 1

Our efficient, smart, flexible, distributed and diverse energy future

UNSW 17 Nov 2016, based on Presentation at APEC Energy Ministers’ Meeting 13 October 2015 Alan Pears AM Senior Industry Fellow RMIT University, Melbourne Australia Associate Consultant Buro North

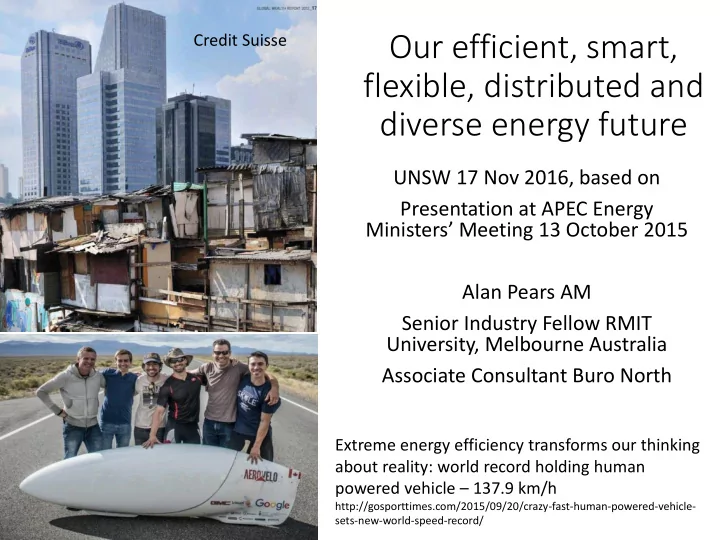
Credit Suisse Extreme energy efficiency transforms our thinking about reality: world record holding human powered vehicle – 137.9 km/h

http://gosporttimes.com/2015/09/20/crazy-fast-human-powered-vehicle- sets-new-world-speed-record/

slide-2
SLIDE 2

The Energy System – driven by demand

Services: Shelter Nutrition Access Entertainment Goods & services End-use technologies: types, efficiencies, usage Demand for energy: type, amount and timing Energy production and supply

Need for investment in supply system can be reduced by smart demand-side action. Historically, we have put the supply side ‘cart’ before the demand side ‘horse’

slide-3
SLIDE 3

Change in energy reflects broader disruptive changes in technology and society such as:

  • Internet, ‘virtual’ solutions, dematerialisation
  • Green chemistry and alternatives to process heat
  • New materials – nanotech, graphene etc
  • Computerised design, control, monitoring
  • Modular, decentralised technologies, 3-D printing etc
  • Urbanisation
  • Growth of services economy
  • Globalisation
  • Energy, resources industries are among the last to face

culturally disruptive change and major ‘substitution’ risk

slide-4
SLIDE 4

Energy sector has struggled to come to terms with changing realities – at high cost

slide-5
SLIDE 5

AEMO National Electricity Forecasting Report (2016) p.4

slide-6
SLIDE 6

Key Energy Drivers

  • Our ‘need’ for energy flows from ‘needs’ for services like

nutrition or economic output and the materials, products, services and business models used to satisfy them

  • Recent innovation dramatically increases options to satisfy

‘needs’ – substitution by radically different alternatives

  • These involve integrated use of combinations of:
  • Innovative reframing of what our needs are (eg virtual solutions)
  • Diverse business models, markets and technology supply chains
  • More efficient energy and resource use
  • Smart management of demand
  • Storage of energy in many forms (heat, coolth, electricity,

chemical, gravitational potential, movement)

  • Distributed and diversified energy production or conversion
slide-7
SLIDE 7

The ‘energy’ service delivery system – many optio tions of f very ry dif ifferent kin inds now exi xist and compete in in dif ifferent markets. .

Mine/Harvest (EE) Transport (EE) Conversion (eg refine, generate electricity) (EE) Deliver to consumer (pipeline, ship, truck, power line etc) (EE) On-site infrastructure (eg meter, analysis, wires, pipes) (EE) On-site energy consuming equipment (EE) Service delivered S T O R A G E Other inputs, eg chemicals, water G E N E R A T I O N Wholesale energy price Retail energy price Consumer cost of service delivered Fuel price

EE=Energy Efficiency

slide-8
SLIDE 8

Diverse energy service solutions are emerging. Centralised systems still have a role, but distributed ones are gaining. Combinations of solutions

  • ften work best, and there will be ongoing transition

8

FACTOR CENTRALISED DISTRIBUTED Economies of scale Through larger size Through mass production Flexibility of roll-out Limited Large Capital required, risk, subsidies Large lumps, long-term, subsidies on-going Small lumps, early cash flow, subsidies up-front Innovation and ‘learning from experience’ Slow Fast, from diverse markets and technologies Planning, construction timeframes Long, limited flexibility Short, responsive Resource suitability Fossil fuels, dams Renewable energy, diverse water sources, end-use technologies Resilience to failures, changing conditions Limited Diversity, modularity help Environmental, social impacts Local, regional, global Local, linked to beneficiaries Overall system efficiency Significant losses in conversion, distribution Variable – near point of use, so consumer pays

slide-9
SLIDE 9

Example – Cold Storage:

University of South Australia / Glaciem demonstration project

PCM storage tanks Cold Rooms

  • 120 kWe Refrigeration system
  • 1.4 MWhrs e thermal storage (1% floor area)
  • 200 kWp of solar PV planned
  • 20% IRR for both storage and PV

Potential Integrated Energy Solution On-site energy efficiency:

  • Building: heat reflective paint,

insulation, air locks

  • High efficiency chillers, smart controls

On-site energy storage:

  • Thermal (‘coolth’ using phase change

materials - PCMs)

  • Electricity

On-site energy production:

  • Rooftop solar PV
  • Use waste chiller heat to dehumidify,

cool, heat (eg cleaning water)

Integrated energy management

  • Optimise operating cost
  • Optimise exports and imports of

electricity

  • Maybe go ‘off-grid’ or micro-grid?
  • Maybe cooperate with other local

generation, storage and energy users?

slide-10
SLIDE 10

Aluminium smelting: strategies and research

projects to cut energy use

  • Big picture options to cut aluminium energy use per unit service:
  • ‘virtual’ solutions replace physical ones
  • Design of products for optimal material use
  • High strength alloys, 3-D printing use less material
  • Switch to other materials, eg carbon fibre
  • Use recycled aluminium
  • R&D, eg ARPA-E projects (US government R&D program)
  • Alcoa: heat exchanger (using molten glass or salt) built-into pot casing

improves insulation, provides flexibility in electricity demand (using heat storage); improved electrodes – 50% saving target

  • Gas Technology Institute: use reusable solvents (chemical dissolution) at

near room temperature; could be located near bauxite mines – 44% cost reduction target

  • Infinium: new electrochemical cell, much better insulated and high value

by-product (pure oxygen); drop-in retrofit – 50% net saving target

  • Shift to renewable electricity

Aluminium smelting uses 3.3% of global electricity

slide-11
SLIDE 11

Industrial steam

  • Avoid use of steam: centrifuge,

microfiltration, depressurisation*

  • Advanced high temperature heat

pump (up to 165C)*

  • Modular hot water or steam

generator*

  • Renewable heat sources
  • Storage (heat or electricity)

* Can use renewable electricity

Graphics from IEA HPP Annex 35 Application of Industrial Heat Pumps, Task 3 (2013)

slide-12
SLIDE 12

Residential: Technology transformation

(Based on Pears presentation to Sydney A2SE Workshop, April 2014)

500 1000 1500 2000 2500 3000 3500 4000

Heating and cooling Refrigeration Hot water Lighting TV/AV/IT Cooking Clothes washing Kilowatt-hours per year

Annual electricity use for some activities in an Australian home: existing stock; best available now; and possible future

STOCK BEST NOW POSSIBLE

Many households are also installing on-site and local renewable energy generation and smart management systems – and next, storage

Building + equipment

slide-13
SLIDE 13

Energy policy tools

  • Strategies and targets – visions
  • Information, promotion, training
  • Voluntary agreements, public reporting
  • Regulation, standards
  • Taxes and levies, pricing
  • Incentives, subsidies and financial facilitation
  • Market mechanisms
  • Innovation, RD&D, commercialisation
  • Government purchase and example
  • Institutional frameworks and resourcing
  • Managing access to markets and resources
  • Management of perceived risks and opportunities
  • Other policies adapted to achieve energy goals too
slide-14
SLIDE 14

From IEA Energy and Climate Change presentation, London June 15 2015

slide-15
SLIDE 15

Indicative technology cost trends:

NOTE: projected costs are very uncertain, but key trends are declining costs and more rapid roll-out than expected: typically 20% reduction for each cumulative doubling of production From Greenpeace Energy [R]evolution 2015

From IRENA REmap Electricity Storage 2015

Many energy efficiency measures have negative cost

slide-16
SLIDE 16

Evaluation of Costs and Benefits

  • Sophisticated evaluation of cost-effectiveness must

consider many factors:

  • Local circumstances
  • What price does it compete with: wholesale, retail energy price?

And what will those prices be?

  • For efficiency measures, what total service cost does it compete

with?

  • What non-energy market(s) does it compete in?
  • What other costs does it avoid: avoided infrastructure costs;

distribution/delivery costs and losses; peak loads

  • What other benefits: avoided blackouts; improved productivity,

health, product quality etc (see IEA Multiple Benefits of EE report); benefits for rural and other disadvantaged groups

  • Impacts on total level of energy subsidies, energy security, social

systems

  • Impact of likely future levels of carbon prices or equivalent

policies on cost relative to competitors

slide-17
SLIDE 17

Where to Now for APEC?

  • No-one knows which options will be winners, so we need:
  • Flexible strategies, quality information and detailed monitoring of

change

  • To encourage innovation, trials, knowledge sharing, creative finance

models

  • To support emerging options to compete with powerful incumbent

businesses

  • To manage disruption, inefficiencies and mistakes
  • Different solutions will be best in different circumstances,

depending on service requirements, available options and local cultures and policies

  • There will be winners and (often powerful and noisy) losers
  • Climate response and adaptation will be overarching drivers
slide-18
SLIDE 18

APEC Actions?

  • Encourage APEC members to develop and implement energy

strategies that:

  • Are consistent with decarbonisation by 2050 or earlier
  • Are flexible and adaptable to unexpected changes, innovation
  • Factor into energy option evaluation factors such as reframing of

‘energy needs’, economies of scale, learning by doing, ‘multiple benefits’, innovation in and from other sectors, etc

  • Incorporate clean energy elements into policies across the economy

and society (eg housing, social welfare, taxation)

  • Work with member countries, IEA etc to:
  • Track and share actual costs, benefits, experience and progress of

emerging technologies and underlying policies and measures

  • Develop, trial and implement planning methodologies, institutional

arrangements and funding systems (eg through ABAC) that support integrated energy solutions

  • Ensure emerging technologies are not blocked by institutional

inertia or incumbent power

slide-19
SLIDE 19

The international energy scene will change

Will new ‘energy giants’ emerge, eg countries leading in smart, efficient energy solutions; with major renewable energy resources such as solar, geothermal resources using advanced drilling techniques from the oil industry? Source: http://pubs.usgs.gov/gip/dynamic/fire.html

THE END - Discussion