
SLIDE 1
p r o b a b i l i t y d i s t r i b u t i o n s
MDM4U: Mathematics of Data Management
“Normal” Data
Properties of the Normal Distribution
- J. Garvin
Slide 1/14
p r o b a b i l i t y d i s t r i b u t i o n s
Discrete vs. Continuous Data
Recap
Identify the discrete probability distribution that is appropriate for each scenario.
- Tossing heads exactly four times in ten tosses of a fair
- coin. Binomial.
- Obtaining three hearts in a random seven-card hand.
Hypergeometric.
- Counting the number of rolls of a die until a four is
- rolled. Geometric.
- J. Garvin — “Normal” Data
Slide 2/14
p r o b a b i l i t y d i s t r i b u t i o n s
Discrete vs. Continuous Data
Each of the previous scenarios involves discrete data – there are “gaps” between values of the random variable involved. Some data are continuous – they can assume any value within a specified range. Common examples of continuous data are height, distance, mass, temperature, etc. If data are continuous, a discrete probability distribution cannot be used as a model. Instead, we must choose a continuous probability distribution.
- J. Garvin — “Normal” Data
Slide 3/14
p r o b a b i l i t y d i s t r i b u t i o n s
Properties of the Normal Distribution
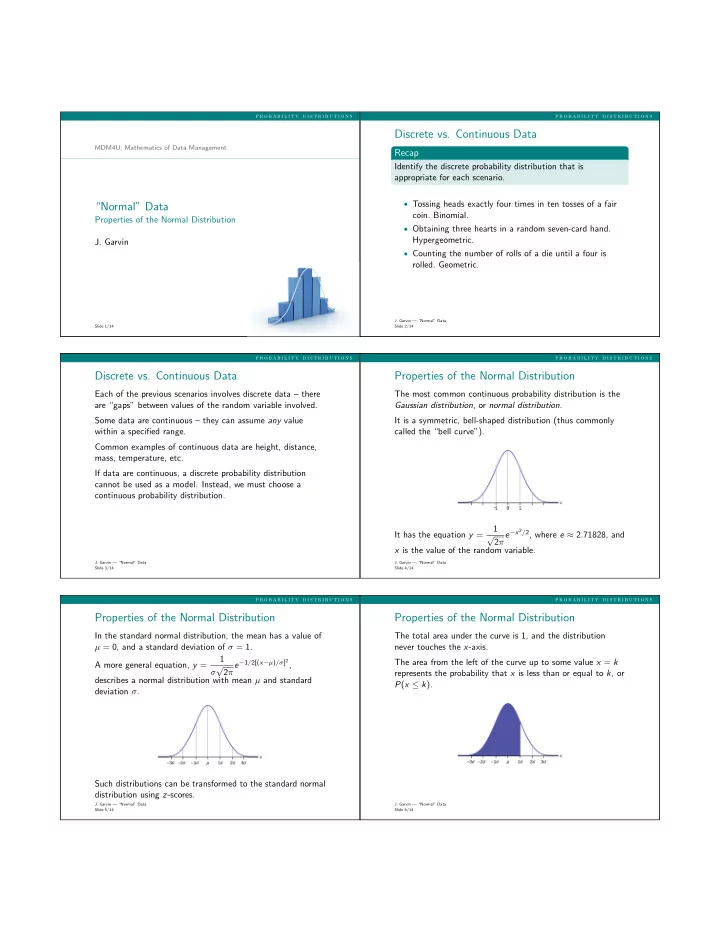
The most common continuous probability distribution is the Gaussian distribution, or normal distribution. It is a symmetric, bell-shaped distribution (thus commonly called the “bell curve”). It has the equation y = 1 √ 2π e−x2/2, where e ≈ 2.71828, and x is the value of the random variable.
- J. Garvin — “Normal” Data
Slide 4/14
p r o b a b i l i t y d i s t r i b u t i o n s
Properties of the Normal Distribution
In the standard normal distribution, the mean has a value of µ = 0, and a standard deviation of σ = 1. A more general equation, y = 1 σ √ 2π e−1/2[(x−µ)/σ]2, describes a normal distribution with mean µ and standard deviation σ. Such distributions can be transformed to the standard normal distribution using z-scores.
- J. Garvin — “Normal” Data
Slide 5/14
p r o b a b i l i t y d i s t r i b u t i o n s
Properties of the Normal Distribution
The total area under the curve is 1, and the distribution never touches the x-axis. The area from the left of the curve up to some value x = k represents the probability that x is less than or equal to k, or P(x ≤ k).
- J. Garvin — “Normal” Data
Slide 6/14