
SLIDE 1
Dinosaur Presentation Example Velociraptor Slide #1 : Dinosaur Name - - PowerPoint PPT Presentation
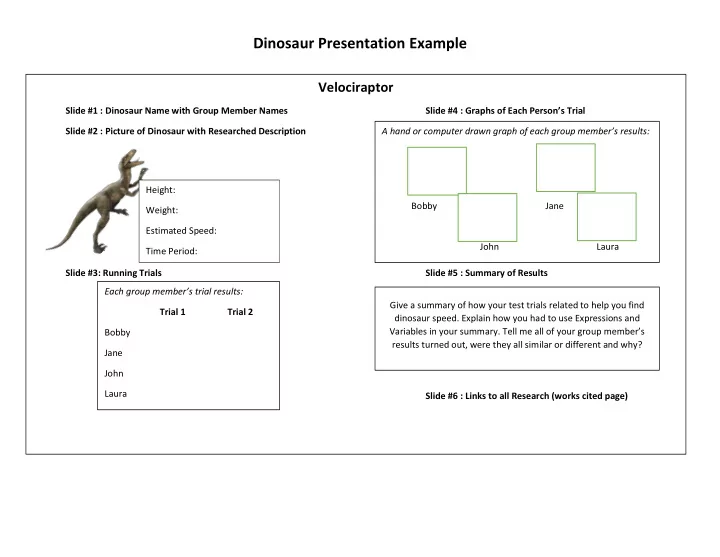
Dinosaur Presentation Example Velociraptor Slide #1 : Dinosaur Name with Group Member Names Slide #4 : Graphs of Each Person s Trial Slide #2 : Picture of Dinosaur with Researched Description A hand or computer drawn graph of each group
Students participate in each activity and share work equally. Group members show support for other team members by working together. Equal level of work based on group participation survey. Students participates in at least 4 out of the 5 activities and share work equally. Group members show support for other team members by working
work based on group participation survey. Students participates in at least 3
some work equally. Group members show some support for
based on group participation survey. Students participates in at least 2 to 1 of the 5 activities. Group members did not show support. Level of work in group written as a concern in group survey.
Student found and answered all research topics and shared research with group members. Student cited resources through links. Research paper was turned in a timely manner. Student found and answered most research topics and shared research with group
resources through links. Research paper was turned in a timely manner. Student found and answered some research topics. Student cited some resources through links. Research paper was done in a somewhat timely manner Student found and answered few research topics. Student did not cite resources with links. Research paper was not completed in a timely manner.
Student completed all test results for themselves and supported group members as they completed their testing and results. Work is shown in a neat and organized fashion. Student completed most test results for themselves and somewhat supported group members as they completed their testing and results. Work is shown in a clear way. Student completed some test results for themselves and showed a little support for group members as they completed their testing and
somewhat clear way. Student participated very little in the test results for themselves and did not show a lot of support for finishing members. Work is incomplete or disorganized.
Student completes their graph and supports group members as they complete their own
labels, organized, and few of errors. Student completes their graph and shows some support towards group members as they complete their own graphs. Graph includes all labels, is neat, and has minor errors. Student completes their graph and gives very little support to group members as they complete their
labels, is clear, and has minor errors. Student somewhat completes their
components and disorganized.
Students work together as a group to do research, share ideas, and build presentation. Work shown in a neat and
clear, precise and covers a description of all Dino Days. Students work together as a group to do research, share ideas, and was very little off task while building presentation. Summary is neat, organized and covers a description of all Dino Days. Students sometimes worked together as a group to do research, share ideas, and build
neat and organized fashion. Summary is neat and somewhat covers a description of all Dino Days. Students rarely worked together as a group to do research, share ideas, and build presentation. Work is disorganized and unclear. Summary is off topic and unclear
Days.
Each student has a specific topic to talk about in their
lasts from 3 to 7 minutes. Student’s voice is clear and topic is well rehearsed. Presentation is well thought out and in the format of video, animation, power point, or poster board. Each student has a specific topic to talk about in their
lasts less than 3 or more than 7
somewhat clear and topic is
thought out and in the format of video, power point, or poster board. Some students talk more than
presentation lasts less than 3 or more than 7 minutes. Student’s voice is clear and topic is
format of video, power point, or poster board. Students are off topic and/or only
than 2 or more than 8 minutes. Topic seems foreign to student. Presentation is not organized in the format of video, power point, or poster board.