DIGITAL INSIDE DENSITY PROFILE ACQUISITION METHOD OF CARBON/CARBON - - PDF document

digital inside density profile acquisition method of
SMART_READER_LITE
LIVE PREVIEW

DIGITAL INSIDE DENSITY PROFILE ACQUISITION METHOD OF CARBON/CARBON - - PDF document

18 TH INTERNATIONAL CONFERENCE ON COMPOSITE MATERIALS DIGITAL INSIDE DENSITY PROFILE ACQUISITION METHOD OF CARBON/CARBON COMPOSITE BY A COMPUTED TOMOGRAPHY N. G. Yun*, D. R. Kim J. Y. Lee Agency for Defense Development, Yuseong P.O. Box35,


slide-1
SLIDE 1

18TH INTERNATIONAL CONFERENCE ON COMPOSITE MATERIALS

1 Introduction Carbon/carbon composite has many inside voids and mechanical and thermal properties can be diminished by the inside voids. This paper describes the inside digital density profile evaluation study of the carbon/carbon materials for a missile propulsion

  • system. The standard density specimens which

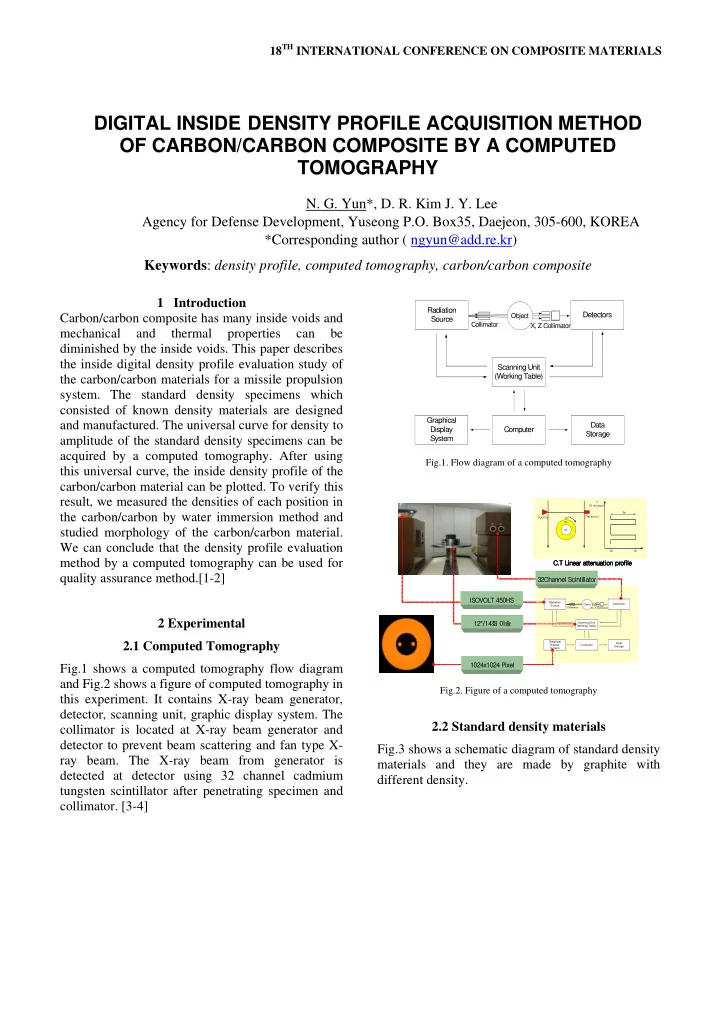
consisted of known density materials are designed and manufactured. The universal curve for density to amplitude of the standard density specimens can be acquired by a computed tomography. After using this universal curve, the inside density profile of the carbon/carbon material can be plotted. To verify this result, we measured the densities of each position in the carbon/carbon by water immersion method and studied morphology of the carbon/carbon material. We can conclude that the density profile evaluation method by a computed tomography can be used for quality assurance method.[1-2] 2 Experimental 2.1 Computed Tomography Fig.1 shows a computed tomography flow diagram and Fig.2 shows a figure of computed tomography in this experiment. It contains X-ray beam generator, detector, scanning unit, graphic display system. The collimator is located at X-ray beam generator and detector to prevent beam scattering and fan type X- ray beam. The X-ray beam from generator is detected at detector using 32 channel cadmium tungsten scintillator after penetrating specimen and

  • collimator. [3-4]

Fig.1. Flow diagram of a computed tomography Fig.2. Figure of a computed tomography

2.2 Standard density materials Fig.3 shows a schematic diagram of standard density materials and they are made by graphite with different density.

Radiation Source Scanning Unit (Working Table) Computer Graphical Display System Data Storage Detectors

Object Collimator X, Z Collimator

Radiation Source Scanning Unit (Working Table) Computer Graphical Display System Data Storage Detectors Object Collimator X, Z Collimator

ISOVOLT 450HS 12°/14회 이송 32Channel Scintillator 1024x1024 Pixel

Δμ Source Detector x (Distance) μb μn μb μn μb

C.T Linear attenuation profile

Radiation Source Scanning Unit (Working Table) Computer Graphical Display System Data Storage Detectors Object Collimator X, Z Collimator

ISOVOLT 450HS 12°/14회 이송 32Channel Scintillator 1024x1024 Pixel

Δμ Source Detector x (Distance) μb μn μb μn μb

C.T Linear attenuation profile

Δμ Source Detector x (Distance) μb μn μb μn μb

C.T Linear attenuation profile

DIGITAL INSIDE DENSITY PROFILE ACQUISITION METHOD OF CARBON/CARBON COMPOSITE BY A COMPUTED TOMOGRAPHY

  • N. G. Yun*, D. R. Kim J. Y. Lee

Agency for Defense Development, Yuseong P.O. Box35, Daejeon, 305-600, KOREA *Corresponding author ( ngyun@add.re.kr) Keywords: density profile, computed tomography, carbon/carbon composite

slide-2
SLIDE 2

Fig.3. Schematic diagram of standard density material

3 Results 3.1 Correction of linear beam hardening Computed tomography image is affected by linear beam hardening and Fig.4 shows a corrected image by polychromatic correction method. Fig.4. Correction of beam hardening 3.2 Density distributions by voxel size The voxel size from computed tomography is shown in Fig. 5. If a void is existed in a voxel by the computed tomography image the calculated density will be decreased and the density distribution will be

  • broad. The density of standard density materials is

related to CT number and table 1 shows normal distribution of standard density materials A, B, C, D and table 2 shows confidence level for each voxel size.

Fig.4. Schematic diagram of voxel image Fig.5. Standard deviation according to voxel size Table 1 CT number of the standard density materials

Standard density materials CT number Min Max Mean RMSD Percent A 17,669 18,795 18,247.59 184.73 1.012 B 17,809 19,048 18,370.69 185.60 1.010 C 18,331 19,679 19,045.14 193.47 1.016 D 18,901 20,224 19,548.53 216.90 1.110

Table 2 Confidence level for each voxel size

Voxel size Min Max Mean RMSD Confidence 0.2×0.2×1.5 mm 18901.00 20224.00 19548.53 216.91 42.00% 1.0×1.0×1.5 mm 19269.30 19794.80 19548.53 101.35 76.37% 2.0×2.0×1.5 mm 19448.91 19666.84 19548.53 49.18 98.53%

B A D C 90° 180° φ 73.0

+0.0

  • 0.2

73.2 140

15 15 15

φ 15.2

+0.1

  • 0.0

A B C D

+0.0

  • 0.2

φ 15.0 140

12.5 20.00

밀도 A: 1.7489 g/cm3 B: 1.7595 g/cm3 C: 1.8188 g/cm3 D: 1.8566 g/cm3

0° 270°

100 200 300 400 5000 10000 15000 20000

CT number Distance(mm) Modification imgage Origainal image

2 mm 2 mm 1 mm Voxel Size(0.2x0.2x1.5 mm)

17500 18000 18500 19000 19500 20000 20500 21000 0.000 0.004 0.008 0.012 0.016 0.020 0.024 Standard Material D Standard Material C Standard Material A Voxel Size(0.2x0.2x1.5 mm) Voxel Size(1.0x1.0x1.5 mm) Voxel Size(2.0x2.0x1.5 mm)

f(x) CT number

Standard Material B

slide-3
SLIDE 3

3.3 CT number profiles of carbon/carbon composite

  • Fig. 6 and Fig. 7 shows CT number profile of

carbon/carbon composite from computed tomography.

Fig.6. CT number of X axis Fig.7. CT number of Y axis

3.4 Density distributions of carbon/carbon The results of digital inside density profile acquisition program shows Fig.8-9.

Fig.8. Procedure of digital inside density profile acquisition program Fig.9. Result of digital inside density profile acquisition program

3.5 Morphology of carbon/carbon

  • Fig. 10 shows carbon/carbon composite inside

morphology.

Fig.10. Morphology of carbon/carbon composite

20 40 60 80 100 120 140 160 180 200 1.76 1.78 1.80 1.82 1.84 1.86 1.88 1.90 270

  • C

270

  • B

270

  • A

90

  • A

90

  • B

90

  • C

Density(g/cm

3)

Distance(mm) 20 40 60 80 100 120 140 160 180 200 1.76 1.78 1.80 1.82 1.84 1.86 1.88 1.90

  • C
  • B
  • A

180

  • A

180

  • B

180

  • C

Density(g/cm3) Distance(mm)

slide-4
SLIDE 4

4 Conclusions The standard density materials are designed and the CT number of 2.0 x 2.0 x 1.5mm voxel size by the computed tomography is converted to the density value in the carbon/carbon material. The converted density value is compared to real density by water immersion method. Two density values are very similar at same position in the carbon/carbon material. References

[1] D. H. Phillips and J. J. Lannutti, "Measurement

physical density with X-ray computed tomography", NDT & E International, vol. 30, 1997, pp.339-350

[2] R. T. Lopes, H. S. Rocha, E. F. O. de Jesus, R. C.

Barroso, L. F. de Oliveira, M. J. Anjos, D. Braz and S. Moreira, "X-ray transmission microtomography using synchrotron radiation", Nuclear Instruments and Methods in physics Research, 2003, pp.604-607

[3] “Radiography and Radiation testing”, ASNT

Non destructive Handbook 2Ed, Vol 3, Section 5, 1985, pp.839-878

[4] “Standard Guide for Computed Tomography

(CT) Imaging”, ASTM E1441-00, pp.1-32, (1992)