
SLIDE 1
21/3/04 1
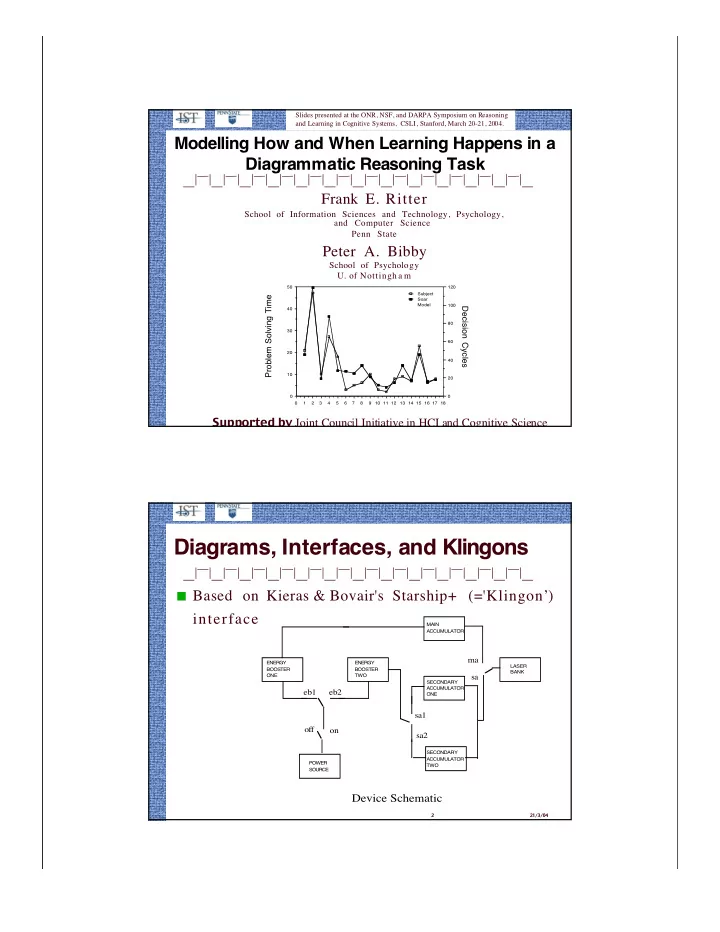
Modelling How and When Learning Happens in a Diagrammatic Reasoning Task
Problem Solving Time Decision Cycles
1 2 3 4 5 6 7 8 9 10 11 12 13 14 15 16 17 18 10 20 30 40 50 20 40 60 80 100 120 Subject Soar Model
Frank E. Ritter
School of Information Sciences and Technology, Psychology, and Computer Science Penn State
Peter A. Bibby
School of Psychology
- U. of Nottingh a m
Supported by Joint Council Initiative in HCI and Cognitive Science
Slides presented at the ONR, NSF, and DARPA Symposium on Reasoning and Learning in Cognitive Systems, CSLI, Stanford, March 20-21, 2004.
21/3/04 2
Diagrams, Interfaces, and Klingons
ENERGY BOOSTER ONE MAIN ACCUMULATOR POWER SOURCE SECONDARY ACCUMULATOR TWO SECONDARY ACCUMULATOR ONE ENERGY BOOSTER TWO LASER BANK
- ff
- n
eb1 eb2 sa1 sa2 ma sa
Device Schematic ■ Based on Kieras & Bovair's Starship+ (='Klingon’)