
SLIDE 1
Transactions of the Korean Nuclear Society Virtual Spring Meeting July 9-10, 2020
Development to Diagnose Model of Abnormal Status in Nuclear Power Plant Operation using Machine Learning Algorithms
Ho Sun Ryua*, Kwang Nam Yub,Yun Goo Kima
aKorea Hydro and Nuclear Power Co., ltd, Central Research Institute, Daejeon, Korea bDacon Co., Seoul, Korea
*Corresponding author : hosunryu@khnp.co.kr
- 1. Introduction
When an abnormal status occurs in a nuclear power plant, the operator determines the abnormal condition and takes action according to each manual. However, nuclear power plants have over 80 abnormal conditions. And there are more than 200 events inside the abnormal state and there are many driving variables. Therefore, the operator may have difficulty determining the abnormality. And, depending
- n the level of the operators, a difference may occur in
judging and handling abnormal conditions. So, KHNP CRI is conducting research projects to automatically determine abnormal conditions using artificial intelligence(AI).[1] In addition, in order to apply the latest artificial intelligence technology in the research project and secure the foundation for technological exchange with artificial intelligence experts, an artificial intelligence model development competition (hackathon) was held online. In this paper, we introduce the hackathon competition promoted for the development of AI models and evaluate them on the developed AI models.
- 2. Generating train and test data
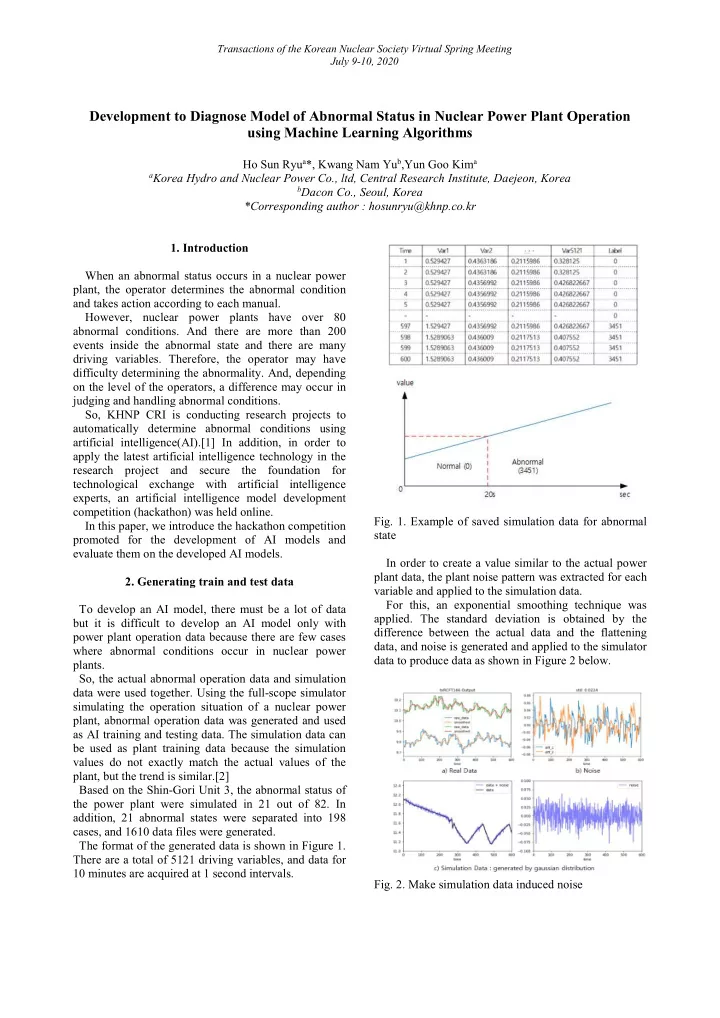
To develop an AI model, there must be a lot of data but it is difficult to develop an AI model only with power plant operation data because there are few cases where abnormal conditions occur in nuclear power plants. So, the actual abnormal operation data and simulation data were used together. Using the full-scope simulator simulating the operation situation of a nuclear power plant, abnormal operation data was generated and used as AI training and testing data. The simulation data can be used as plant training data because the simulation values do not exactly match the actual values of the plant, but the trend is similar.[2] Based on the Shin-Gori Unit 3, the abnormal status of the power plant were simulated in 21 out of 82. In addition, 21 abnormal states were separated into 198 cases, and 1610 data files were generated. The format of the generated data is shown in Figure 1. There are a total of 5121 driving variables, and data for 10 minutes are acquired at 1 second intervals.
- Fig. 1. Example of saved simulation data for abnormal
state In order to create a value similar to the actual power plant data, the plant noise pattern was extracted for each variable and applied to the simulation data. For this, an exponential smoothing technique was
- applied. The standard deviation is obtained by the
difference between the actual data and the flattening data, and noise is generated and applied to the simulator data to produce data as shown in Figure 2 below.
- Fig. 2. Make simulation data induced noise