descriptive statistics
play

Descriptive Statistics there will be a lot of data This is a good - PDF document

4/14/2017 Summarizing Data IMGD 2905 With lots of playtesting, Descriptive Statistics there will be a lot of data This is a good thing! But raw data is just a pile Chapter 3 of numbers Rarely of interest Or even sensible


  1. 4/14/2017 Summarizing Data IMGD 2905 • With lots of playtesting, Descriptive Statistics there will be a lot of data – This is a good thing! • But raw data is just a pile Chapter 3 of numbers – Rarely of interest – Or even sensible • Q: How to summarize all this information? Measure of Central Tendency: Mean Summarizing Data • With lots of playtesting, there will be a lot of data – This is a good thing! • But raw data is just a pile of numbers – Rarely of interest http://www.cdn.sciencebuddies.org/Files/463/9/MeanEquation.jpg • 
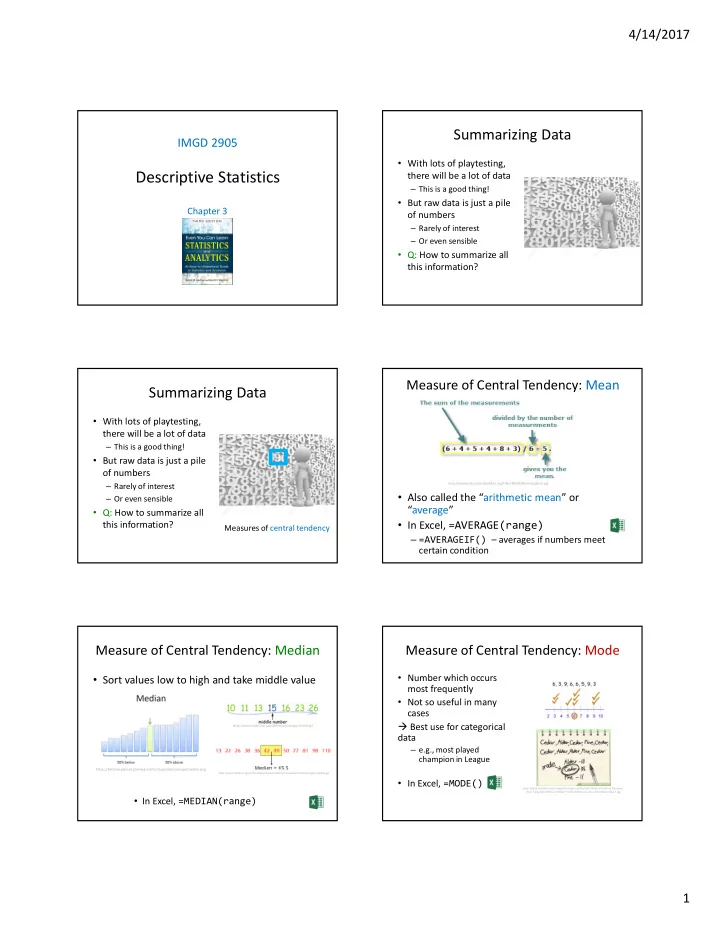
Also called the “arithmetic mean” or – Or even sensible “average” • Q: How to summarize all • In Excel, =AVERAGE(range) this information? Measures of central tendency – =AVERAGEIF() – averages if numbers meet certain condition Measure of Central Tendency: Median Measure of Central Tendency: Mode • Number which occurs • Sort values low to high and take middle value most frequently • Not so useful in many cases  Best use for categorical https://www.mathsisfun.com/definitions/images/median.gif data – e.g., most played champion in League https://betterexplained.com/wp-content/uploads/average/median.png http://www.nedarc.org/statisticalHelp/basicStatistics/measuresOfCenter/images/median.gif • In Excel, =MODE() http://pad3.whstatic.com/images/thumb/c/cd/Find-the-Mode-of-a-Set-of-Numbers- Step-7.jpg/aid130521-v4-728px-Find-the-Mode-of-a-Set-of-Numbers-Step-7.jpg • In Excel, =MEDIAN(range) 1

  2. 4/14/2017 Depiction: Mean, Median, Mode Which to Use, Mean, Median, Mode? mean modes median mode frequency frequency mean median no mode frequency mean (a) (b) median mode mode frequency median frequency (c) median mean mean (d) (d) Other Measures of Position Which to Use, Mean, Median, Mode • Mean many statistical tests with sample • May not always want center – Estimator of population mean – e.g., want to know best Champions – Uses all data • Median is useful for skewed data – e.g., income data (US Census) or housing prices (Zillo) • What other positions may be desired? – e.g., Overwatch team (6 players): 5 people level 5, 1 person level 275 • Mean is 50 - not so useful since no one at this level • Median is 5 - more representative – Does not use all data. “Resistant” to extremes (e.g., 275) ? – But what if were exam scores? Hard to “bring up” grade • Mode is useful primarily for categorical data only – Most played League champion, most popular TagPro map, … Other Measures of Position Trimmed Mean • Maximum / Minimum • Take “trimming” off top and bottom (typically – Not discussed more 5% or 10%) – Reduces effects of extreme values, like median • Trimmed Mean • In Excel, =TRIMMEAN(array,percent) • Quartiles • Percentiles Blue – original mean Red – trimmed mean http://support.minitab.com/en-us/minitab/17/histogram_mean_vs_trimmed_mean.png 2

  3. 4/14/2017 Percentiles Quartiles • Generalization of quartiles • Sort values • N th percentile is data point n % from bottom of • First quartile (Q1) is 25% from bottom data • Third quartile (Q3) is 75% from bottom • Interpolate as for first quartile • (What is second quartile?) • In Excel, =PERCENTILE(array,k) (k: 0 to 1) • In Excel, =QUARTILE(array,n) https://www.mathsisfun.com/data/images/percentile-80.svg https://mathbitsnotebook.com/Algebra1/StatisticsData/quartileboxview2.png https://www.hackmath.net/images/quartiles.png http://www.isical.ac.in/~jeexiiscore_normal/PercentilesAdvantages.htm http://www.psychometric-success.com/images/AA1301.gif Summarizing Data, Part 2 Summarizing Data, Part 2 • Ok, pile of numbers can • Ok, pile of numbers can now be summarized as now be summarized as one number one number – Mean, median, mode – Mean, median, mode • But is that enough? • But is that enough? • Q: What other major • Q: What other major aspect of numbers aspect of numbers haven’t we summarized? haven’t we summarized? Measures of variation ( aka measures of dispersion, or measures of spread ) Summarizing Data, Part 2 Variation Overview (1 of 3) • Is data clumped or spread out? “Then there is the man who drowned crossing a stream with an average depth of six inches.” – W.I.E. Gates • Summarizing by single number rarely enough  need statement about variation Frequency Frequency mean mean https://mathbitsnotebook.com/Algebra1/StatisticsData/STSpread.html Player High Score Player High Score Above: does single number (mean) tell you enough about data? 3

  4. 4/14/2017 Variation Overview (2 of 3) Variation Overview (3 of 3) • Is data clumped or spread out? • Is data clumped or spread out? “Motion and Scene Complexity for Streaming Video Games” What are Some Measures of Range • Difference between smallest and largest value Variation? • Somewhat obvious, but doesn’t tell you much about “clumping” – Minimum may be zero – Maximum can be from outlier • Event not related to phenomena studied – Maximum gets larger with # samples, so no “stable” point • In Excel, =MAX(array)-MIN(array) Range = 96 – 69 = 27 Max Min http://idolosol.com/images/range-3.jpg Variance Example Variance • Sample kills in League of Legends match • Compute mean of sample – 12, 20, 16, 18, 19 – What is sample variance? • Compute how far each value in sample is from mean • First, mean = 85 / 5 = 17 – Some can be less than mean, some greater Kills X – mean (X – mean) 2  So square this difference 12 -5 25 • Divide by number of sample values – 1 20 3 9 – The “-1” corrects “bias” when trying to estimate 16 -1 1 population variance 18 1 1 “sum up all” “mean” 19 2 4 s 2 = (25 + 9 + 1 + 1 + 4) / (5 – 1) = 40 / 4 = 10 kills squared “Larger” means • In Excel, =VAR(array) “more spread” … but units odd 4

  5. 4/14/2017 Standard Deviation Mendenhall’s Empirical Rule • Square-root of variance • About 68% data within one s • Usually, use standard standard deviation of mean deviation instead of – interval between mean-s and variance mean+s contains about 68% of data – Why?  Same units as data • About 95% within 2 (e.g., “kills” in previous example) standard deviations of • Can compare standard mean deviation to mean • Almost all data within 3 (coefficient of variation, standard deviations of next) mean • But first: https://mathbitsnotebook.com/Algebra1/StatisticsData/normalgrapha.jpg • (Rules based on normal – Mendenhall’s Empirical Rule distribution) – Z-score Z-Score Coefficient of Variation (CV) • Measure of how “far” from Shown as percent (multiply by 100) • Size of the standard deviation relative to the center (mean) single data mean point is – e.g., large sd & large mean, – Not measure of dispersion for not so spread – but large sd & small mean, whole data set more spread • Standard deviation divided by mean Example – Can do this since same units! Mean 469 • CV is “unit-less”, so measure Std dev 119 of spread independent of X 650 quantity – E.g. seconds, clicks, spaces Z-score for X? http://bitesizebio.s3.amazonaws.com/wp-content/uploads/2015/01/Spread1.jpg (650 – 469)/119 1.52 https://www.animatedsoftware.com/pics/stats/sgzscor2.gif Index of Variation Example Semi-Interquartile Range ( sorted ) • ½ distance between Q3 (75 th percentile) and Q1 Lap Times • First, sort (24 th percentile) 1.9 • Mean = 4.4 2.7 • Min = 1.9, Max = 5.9 3.9 • Median = [16 / 2] = 8 th = 4.5 4.1 • Q1 = 16 / 4 = 8 th = 4.1 4.2 Q1 Q3 • Q3 = 3 * 16 / 4 = 12 th = 5.1 4.2 4.4 http://www.bbc.co.uk/staticarchive/9629000486ef4b1a40efa565c162cb779e0bd82c.png 4.5 Q3 – Q1 • SIQR = (Q3–Q1) / 2 = 0.5 4.5 2 • Variance 4.8 = 0.96 4.9 • Stddev • Use semi-interquantile (SIQR) for index of = 0.98 5.1 • CV = stddev/mean dispersion whenever using median as index of = 0.22 5.1 • Range = max – min central tendency = 4 5.3 5.6 5.9 5

Download Presentation
Download Policy: The content available on the website is offered to you 'AS IS' for your personal information and use only. It cannot be commercialized, licensed, or distributed on other websites without prior consent from the author. To download a presentation, simply click this link. If you encounter any difficulties during the download process, it's possible that the publisher has removed the file from their server.

Recommend


More recommend