
SLIDE 1
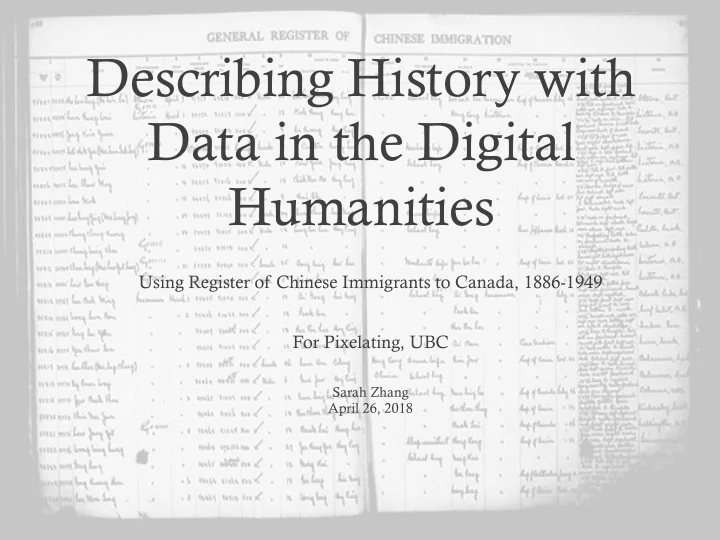
Describing History with Data in the Digital Humanities
Using Register of Chinese Immigrants to Canada, 1886-1949 For Pixelating, UBC
Sarah Zhang April 26, 2018
Describing History with Data in the Digital Humanities Using - - PowerPoint PPT Presentation
Describing History with Data in the Digital Humanities Using Register of Chinese Immigrants to Canada, 1886-1949 For Pixelating, UBC Sarah Zhang April 26, 2018 Background The head tax imposed by the Canadian Government on Chinese Immigrants
Using Register of Chinese Immigrants to Canada, 1886-1949 For Pixelating, UBC
Sarah Zhang April 26, 2018
spreadsheet, 2005-2007
The dataset on Open Collection
Source: Chiang, R., 2016
At level of county: At level of village/town:
The normalized village name-恒美 (code 3793 ) and the corresponding recorded names-codes
Source: Ward, 2013
Mean Height by Age, contrasting 5 birth year cohort.
(n=11,839) for immigrants from Xinhui
Workflow-Producing the visualization of village-destination connection for Zhongshan county, using Palladio
codebook
variable for “target”
Combining with other methods: aggregated statistical and data visualization
allows research at all level of granularity.
and migration patterns uncovered.
Chiang, R.(2016). Canada Immigration Chinese Head Tax Record Sun Woy District. ISSCO 2016: 9th International Conference of the International Society for the Study of Chinese Overseas Ward, W . P. (2013;2012). Stature, migration and human welfare in south china, 1850-1930.Economics and Human Biology, 11(4), 488. doi:10.1016/j.ehb.2012.10.003 Yu, H., Chan, S. (2017). The Cantonese Pacific: Migration Networks and Mobility Across Space and Time. In Wong, L. L. (ed.). Trans-pacific mobilities: The chinese and canada. Vancouver;Toronto;: UBC Press.
From Hermeneutics to Data to Networks: Data Extraction and Network Visualization of Historical Sources By Marten Düring