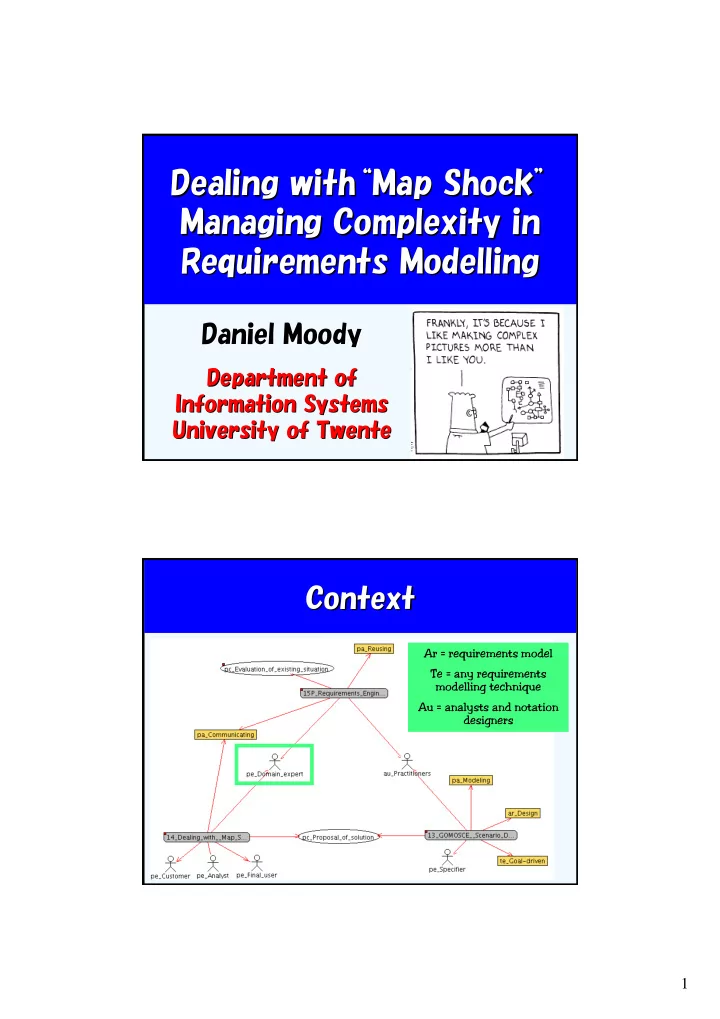
Dealing with with Map Map Shock Shock Dealing Managing - - PDF document

dealing with with map map shock shock dealing managing
SMART_READER_LITE
LIVE PREVIEW

Dealing with with Map Map Shock Shock Dealing Managing - - PDF document

Dealing with with Map Map Shock Shock Dealing Managing Complexity in Managing Complexity in Requirements Modelling Modelling Requirements Daniel Moody Daniel Moody Department of Department of Information Systems


slide-1
SLIDE 1

1

Dealing Dealing with with“ “Map Map Shock Shock” ” Managing Complexity in Managing Complexity in Requirements Requirements Modelling Modelling

Daniel Moody Daniel Moody

Department of Department of Information Systems Information Systems University of University of Twente Twente

Context Context

Ar = requirements model Te = any requirements modelling technique Au = analysts and notation designers

slide-2
SLIDE 2

2

Research Question Research Question

Why Complexity is Such a Problem Why Complexity is Such a Problem in Requirements Engineering in Requirements Engineering

  • 1. The complexity of the underlying systems being

modelled

  • Dijkstra: the complexity of modern software

presents an intellectual challenge that has no precedent in human history

  • 2. Lack of complexity management mechanisms in

most RE notations

  • 3. Models used to communicate with people who

are not technical experts

slide-3
SLIDE 3

3

“ “Map Shock Map Shock” ”

Amount of information that can be effectively conveyed by a single diagram limited by human perceptual and cognitive abilities:

Perception: ability to discriminate between

diagram elements reduces with their number and proximity (≈ 20 elements on A4 paper)

Cognition: number of diagram elements that

can be comprehended at a time limited by working memory capacity (≈ 7 ± 2 elements)

Research Method Research Method

Solve problem for particular modelling technique (ER modelling) and generalise

Field Testing (Action Research) Initial Method Method refinement Laboratory Experiment 1: End User Understanding (O ) Laboratory Experiment 2: Documentation and Maintenance (O ) Field Experiment: Adoption in Practice Revised Method

1 2

8 action research studies

slide-4
SLIDE 4

4

Research Method Research Method

Problem-Specific Learning General Learning

Single Loop Learning (HOW)

Method Outcomes Objectives Principles

Triple Loop Learning (WHY) Double Loop Learning (WHAT)

Solve problem for particular modelling technique and generalise

Research Results Research Results

Graphic Complexity Identification Contextualisation Navigational Map Indexing Signposting Redundancy Summarisation Decomposition Complexity Management Perceptual Grouping Spatial Contiguity

slide-5
SLIDE 5

5

Principle 1: Decomposition Principle 1: Decomposition

Divide large diagrams into cognitively and perceptually manageable chunks

Sub-Diagram 1 Sub-Diagram n Sub-Diagram 2 Sub-Diagram 1

Single interconnected diagram Set of manageable sized sub-diagrams

The Magical Number, Seven, The Magical Number, Seven, Plus or Minus Two Plus or Minus Two

slide-6
SLIDE 6

6

Customer Person Organisation Order Product Supplier Order Item Sales Region

located in

Warehouse Product Stock

consists of relates to

Employee Invoice Item Invoice

relates to consists of placed by

Customer Address

delivery address takes responsible for

Credit Terms

has has

Customer Contract Product Availability Purchase Item Purchase Order

placed by sent to from has is part of has contained in

Payment Apportion ment

made by results in matched to

Payment Product Price

manages

Customer Segment Contract Item

has consists of applies to belongs to has

Customer Contact No

has has

Divide Large Diagrams into Divide Large Diagrams into Manageable Sized Chunks Manageable Sized Chunks

7 ± 2 elements per diagram

Principle 2: Summarisation Principle 2: Summarisation

“Big picture” view: provides

  • verall map into which

information from different diagrams can be integrated

Summary Diagram Detailed Diagrams

summarise (possibly recursively)

...

slide-7
SLIDE 7

7

... ...

Principle 8: Spatial Contiguity Principle 8: Spatial Contiguity

Allow multiple diagrams to appear simultaneously within the visual field

Principle 9: Principle 9: Perceptual Grouping Perceptual Grouping

Use Gestalt principles to group elements together into manageable sized chunks

Both an alternative to and complementary to

decomposition

Unstructured Diagram Diagram organised into perceptual groups

slide-8
SLIDE 8

8

Summary Summary

Quality features: understandability completeness, accuracy Contribution: definition of 9 principles for incorporating complexity management into diagrams and/or notations How will this improve practice/research:

  • Help RE practitioners communicate complex models to

end users

  • Help notation designers incorporate complexity

management into RE notations Main problems: needs to be tested on other types of models Scaling up: based on a real world solution

Interdisciplinary Interdisciplinary Generalisation Generalisation

Requirements models an instance

  • f a more general class of diagrams

called node-link diagrams:

Used in a wide range of

disciplines: business, education, communications, engineering, psychology Potential applications of the research beyond the IS field

ER models Requirements models Node-link diagrams