
SLIDE 1
Day Mung Beans: Shoot MSCon ChangeMS Model 1 1.5 24.45 1 2 - - PowerPoint PPT Presentation
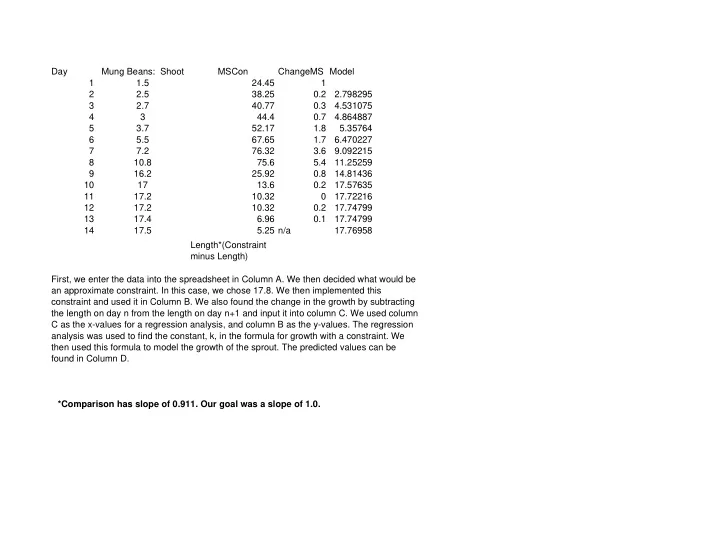
Day Mung Beans: Shoot MSCon ChangeMS Model 1 1.5 24.45 1 2 2.5 38.25 0.2 2.798295 3 2.7 40.77 0.3 4.531075 4 3 44.4 0.7 4.864887 5 3.7 52.17 1.8 5.35764 6 5.5 67.65 1.7 6.470227 7 7.2 76.32 3.6 9.092215 8 10.8