
SLIDE 1
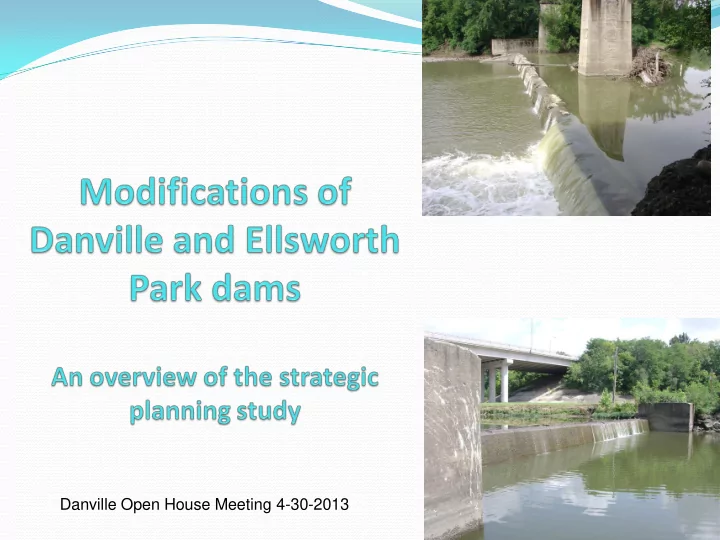
Danville Open House Meeting 4-30-2013
Danville Open House Meeting 4-30-2013 Governors Dam Removal - - PowerPoint PPT Presentation
Danville Open House Meeting 4-30-2013 Governors Dam Removal Initiative Removes 16 low-head dams All dams no longer serve original purpose Safer for all users of the river Improves water quality Removes aging infrastructure
Danville Open House Meeting 4-30-2013
Removes 16 low-head
dams
All dams no longer serve
Safer for all users of the
river
Improves water quality Removes aging
infrastructure
Blackberry Dam - Yorkville, IL Hoffman Dam - Des Plaines, IL
Fatalities and continued deterioration at the dams 2004 - Mayor forms dam technical committee 2006 - IDNR Dam Public Safety Initiative begins 2007 - Evaluation of Public Safety at Run-of-River Dams
published by CTE/AECOM
2009 – At the City’s request, IDNR began a Strategic Study of
Danville & Ellsworth Park Dam
2012 - Governor’s Dam Removal Initiative announced (16 dams
including Danville Dams)
Public Safety Ecological Benefits / Impacts Improved Recreation
Eliminate risk of life loss due to
Create a safe river for all users Reduce the need of emergency
Open 175 river miles for all fish species to move
Improve aquatic habitat within the impacted area Create additional habitat for threatened and
Improve water quality
Enhance the recreational usage for watercraft Enhance recreational fishing opportunities Create a safe, natural area for the public to enjoy
Danville Dam
West abutment undercutting West abutment erosion East abutment undercutting Eroded cap Concrete spalling at dam face
Ellsworth Park
West abutment erosion
Draft Strategic Planning Study Completed
Extensive surveying Sediment collection, testing and modeling Water surface modeling Environmental / aquatic investigation Public safety improvement alternatives
Full Removal Partial Removal Rock Ramp Concrete Steps
All Alternative layouts and costs estimates are conceptual and will be modified in final design
Low Flow Condition (150 cfs), upstream of Danville Dam pool
505 510 515 520 525 530 535 540 545 550
50 100 150 200 250 300 350 400
ELEVATION , IN FEET STATIONING, IN FEET Existing Channel Existing Danville Dam Partial Removal
506 508 510 512 514 516 518 520 522 1000 1050 1100 1150 1200 1250 1300 1350
ELEVATION , IN FEET STATIONING, IN FEET Existing Channel Existing Danville Dam Step Spillway
506 508 510 512 514 516 518 520 522 1000 1050 1100 1150 1200 1250 1300 1350
ELEVATION , IN FEET STATIONING, IN FEET Existing Channel Existing Danville Dam Step Spillway Step WS Existing WS
506 508 510 512 514 516 518 520 1000 1050 1100 1150 1200 1250 1300 1350
ELEVATION , IN FEET STATIONING, IN FEET Existing Channel Existing Danville Dam Rock Ramp
Alternative Total Danville Dam Alternative Costs Total Ellsworth Park Dam Alternative Costs Land Rights Costs 1 - Full Removal $1,464,300 $275,500 $0 2 - Partial Removal $1,832,000 $198,900 $0 3 - Stepped Spillway $3,725,600 $1,043,100 $240,000 4 - Rock Ramp $2,706,700 $1,080,400 $136,000 5 - Do Nothing $0 $0 $0 Recommended $1,832,000 $275,500 $0
*Flood Easements required for the Ellsworth Park Dam Alternatives
Alternative Removes Pool Public Safety Safe Canoe Passage Fish Passage Acres of Easements Tree Removal (Acres) 1 - Full Removal Yes Restored Yes Restored 0.52 2 - Partial Removal Yes Restored Yes Restored 0.52 3 - Stepped Spillway No Improved Portage Improved 60 2.52 4 - Rock Ramp No Improved Portage Improved 34 2.52 5 - Do Nothing No None No Very Limited 0.00
Rivers are like bathtubs, if dammed they are full of
The pool area will become a mud flat We will not be able to fish You will not be able to do any type of boating
November 6, 2011 – 150 cfs
River bottom consists of sands and gravels Sand / Gravel bars will be exposed during low flows
Existing pool formed by dam only extends to just
Kickapoo Landing currently uses the Vermilion to
Water Depth on Ramp (ft) Submerged Length (ft) Existing Initial Removal Long Term Removal 100% 100%* 78% 1 5 99% 99%* 45% 2 10 85% 59% 27% 3 15 58% 23% 16% 4 20 30% 12% 9% 5 25.8 15% 7% 5% 6 32.5 8% 4% 4% Frequency the Depth will be exceeded
*Water depth at confluence may limit access to the Vermilion River
Fishing opportunities will remain 50% of the time, water depth will be 30 inches or
USGS gage is available to check river conditions Lake Vermilion is a great boat fishing resource for
at Danville Dam on the Vermilion River and Ellsworth Park Dam on the North Fork Vermilion River April 30, 2013 Trent Thomas Rivers & Streams Biologist Illinois Department of Natural Resources Division of Fisheries
2004 at Danville Dam: 37 fish species below the
2011 at Danville Dam: 39 fish species below the dam
10 20 30 40 50 2004 2011 DOWNSTREAM UPSTREAM
Danville Dam Ellsworth Park Dam
Total of 54 species Vermilion: 47 North Fork: 31
5 10 15 20 25 E1 E2 E3 E4 E5 E6 5 10 15 20 25 30 35 40 D1 D2 D3 D4 D5 D6 POOL POOL Danville Dam Ellsworth Park Dam
Vermilion
S=12
North Fork
S=8
Vermilion North Fork
Bigeye Chub Channel Catfish River Redhorse Central Stoneroller Golden Redhorse Greenside Darter Silver Redhorse Logperch Black Redhorse Rainbow Darter Shorthead Redhorse Smallmouth Bass Quillback Warmouth Highfin Carpsucker Mosquito Fish Emerald Shiner Freshwater Drum Silverjaw Minnow Yellow Bass
677 1000 840 258 554 396 651 2004 2011 2012 DOWNSTREAM POOL RIVER
531 604 126 176 444 2011 2012 DOWNSTREAM POOL RIVER
177 174 90 54 2004 2011 DOWNSTREAM POOL
46 55 36 34 2004 2011 DOWNSTREAM POOL
Danville Dam Ellsworth Park Dam
The impoundments also appear to be impacting the distribution of rare state-listed fish species in the Vermilion River basin.
9 2 1 2 4 6 8 10 12 14 POOL DOWNSTREAM RIVER REDHORSE EASTERN SAND DARTER BIGEYE CHUB
IDNR Surveys: September 6-8, 2011
0.5 1 1.5 2 1 2 3 4 5 6 7 Frequency INCHES
BLUEGILL AT DANVILLE DAM
DOWNSTREAM UPSTREAM 0.5 1 1.5 2 2.5 3 3.5 4 4.5 1 2 3 4 5 6 7 8 9 10 Frequency INCHES
CRAPPIE AT DANVILLE DAM
DOWNSTREAM 1 2 3 4 5 1 2 3 4 5 6 7 8 9 10 11 12 13 14 15 Frequency INCHES
LARGEMOUTH BASS AT DANVILLE DAM
DOWNSTREAM UPSTREAM 1 2 3 4 5 1 2 3 4 5 6 7 8 9 10 11 12 13 14 15 16 17 18 Frequency INCHES
CATFISH AT DANVILLE DAM
DOWNSTREAM UPSTREAM
EIU Surveys: October 9-15, 2012
20 40 60 80 100 1
BLUEGILL AT DANVILLE DAM
D1 D2 D3 D4 D5 D6 2 4 6 8 10 12 1
CRAPPIE AT DANVILLE DAM
D1 D2 D3 D4 D5 D6
7-10 inches
1 2 3 4 5 6 7 8 1
LARGEMOUTH BASS AT DANVILLE DAM
D1 D2 D3 D4 D5 D6
4-15 inches
2 4 6 8 10 12 14 16 1
CATFISH AT DANVILLE DAM
D1 D2 D3 D4 D5 D6
0-6 inches 6-19 inches
1 2 3 4 5 6 7 1
SMALLMOUTH BASS AT DANVILLE DAM
D1 D2 D3 D4 D5 D6
5 10 2004 2011 POOL DOWNSTREAM
0.5 1 1.5 2 2.5 3 3.5 1 2 3 4 5 6 7 8 9 10 11 12 13 14 Frequency INCHES
SMALLMOUTH BASS AT DANVILLE DAM
DOWNSTREAM UPSTREAM
The Kaskaskia River downstream of Lake Shelbyville similar in size to the Vermilion River shallow with few deep pools.
High quality smallmouth bass fishery. No seasonal migration. Catch rates up to 80 per hour. Large fish over 5 pounds.
Karl Visser - Hydraulic Engineer, USDA
“…clearly shows why these types of dams are so deadly” “Removing the dam will remove public safety hazards and reduce owners
maintenance costs.”
“Removing the dam will change recreational fishing, but the change will be an
improvement.”
“Fish species have flourished in the Baraboo River since four dams were removed”
Visser, K.K. (2005) “Vermilion River Dam Removal or Modification”: 2005 ASCE Water Management Conference, July 19-22, pp. 2-10
Funding have been appropriated for the removal of
Governor’s Dam Removal Initiative of 2012 Part of Governor Quinn’s Jobs Now program
Representatives available during the open house Doug Ahrens – Danville, Director of Public Works David Schnelle – Danville, City Engineer Arlan Juhl – IDNR OWR, Director Rick Gosch – IDNR OWR, Section Manager Loren Wobig – IDNR OWR, Project Manager Wes Cattoor – IDNR OWR, Project Engineer Trent Thomas – IDNR ORC, Fisheries Biologist Submit comments in the comment box or email them to: dnr.dwrm@illinois.gov