
SLIDE 1
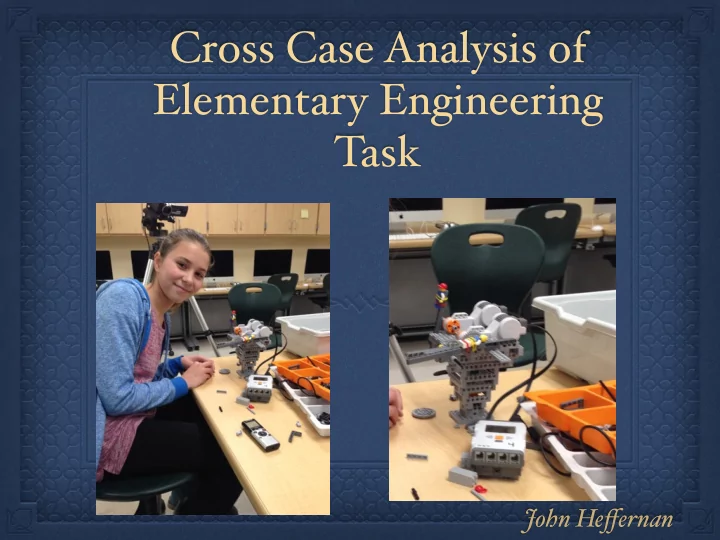
Cross Case Analysis of Elementary Engineering Task
John Heffernan
Cross Case Analysis of Elementary Engineering Task John He ff ernan - - PowerPoint PPT Presentation
Cross Case Analysis of Elementary Engineering Task John He ff ernan Problem Statement Increasing academic focus resulting in loss of designerly play including engineering ( Zhao, 2012 ) . High need for diverse STEM workforce ( Brophy, Portsmore,
John Heffernan
Increasing academic focus resulting in loss of designerly play including engineering (Zhao, 2012). High need for diverse STEM workforce (Brophy, Portsmore, Klein, & Rogers, 2008). Start at elementary (Cunningham & Hester, 2007) Children natural builders Motivating, increase STEM pipeline Integrate math and science Problems solving, modeling, colmaboration
Do grade 2 and grade 6 students’ engineering design processes and final products differ? If so, what are the specific differences? Do male and female students’ engineering design processes and final products differ? If so, what are the specific differences? If differences are not seen by gender and grade level, what relationships do explain the differing final products and engineering design processes of elementary students?
“While much is known about the design processes of older students and experts, there has not been a thorough and in- depth study of elementary student design processes and it is unknown if and how the conclusions and recommendations
Qualitative, Cross Case, Cross-Sectional Semi-clinical video interview (Ginsburg, 1997) Talk aloud protocol (Ericsson & Simon, 1980) Filmed six second grade student and six grade six students doing same open- ended engineering task of amusement park ride with age-appropriate LEGO robotics materials and crafu materials Alm students started with curriculum in K Qualitative analysis of EDP , finished rides, and EDP related codes and activity
W arm up task (roof) Programs Photos of model Design data for each finished model Video tape of sessions - yielded EDP and EDP related data
2 hours of warm task and 8.5 hours of main task Some chalmenges with subjects and videotaping Completed November-December 2015 Multiple “track” issues with building and talking Transcription, time-stamping, segmenting, coding 312 pages of segmented, coded transcripts
W arm Up Task - time, function, process (rubric) Ride quality - originality, function, process (rubric) Finished Model Design Data - #parts, time, use of different parts (motors, computer, crafus, sensors, gears, etc), stability, symmetry, scale Self Efficacy
No major differences by gender or grade level! Differences noted related to LEGO Experience and EDP process But what exactly are the underlying factors? W
by gender or grade level?
EDP Timeline Graphs produced for alm 12 subjects Compared EDP timeline graphs (see examples) Also tabulated EDP phase fsequencies, total phase times, and durations of each phase (see examples) First, some background and methodology
[00:32:41] {moving} [00:32:49] {no_ac5vity} Researcher: Yeah. There's always a challenge. [00:32:51[ {searching} Girl 05: Hmm. Trying to think about this. If I have this, that, that'll be
[00:32:53] {connec5ng} [00:33:22] Girl 05: How am I going to connect that? It'll be like ... [00:33:26] {moving} [00:33:28] {connec5ng} Girl 05: Yeah, okay. Researcher: Great idea. [00:33:33] {measuring} Girl 05: Okay, where did my middle ... [00:33:37] Girl 05: Yeah. Then it'll ... [00:33:38] {connec5ng} [00:33:40] {moving} [00:33:42] Girl 05: Weird.
Girl 5 Segmented Coded Example [00:32:41] [EVALUATE] {moving} [00:32:49] [PLAN] {no_ac5vity} Researcher:
[00:32:51] [PLAN] {searching} Girl 05: Hmm. Trying to think about this. [00:32:57] [RESEARCH] Girl 5: If I have this, that, that'll be upright. Yeah, that seems like it'll work. If I put one of these on each, I hope this will work. Put this on that, and that will run with ... [00:32:53] {connec5ng} [00:33:22] Girl 05: How am I going to connect that? It'll be like ... [00:33:26] {moving} [00:33:28] [BUILD] {connec5ng} Girl 05: Yeah, okay. Researcher: Great idea. [00:33:33] {measuring} Girl 05: Okay, where did my middle ... [00:33:37] Girl 05: Yeah. Then it'll ... [00:33:38] {connec5ng} [00:33:40] [EVALUATE] {moving} [00:33:42] Girl 05: Weird.
1 2 3 4 5 6 0:00:00 0:00:43 0:01:26 0:02:10 0:02:53 0:03:36 0:04:19
Code
Code
1 2 3 4 5 6 0:00:00 0:00:43 0:01:26 0:02:10 0:02:53 0:03:36 0:04:19
Sample EDP Timeline EXCEL Technique
Code
Over 80% (83.3%) intercoder reliability was achieved using Krippendorff’s alpha (Freelon, 2010; Krippendorff, 2007) on 20% of the video. The 80% threshold same or better than similar studies with colmege level engineering students (Atman et al., 2005). 3% of the video was coded together. 7% was coded independently with the two coders meeting afuer to resolve differences and refine the code definitions. 10% was coded independently and used to calculate the intercoder reliability. Researcher coded the remaining 80% of the transcripts. Systemic errors counted once. Given fsequently separate verbal and physical tracks, the reliability achieved was considered high. A total of 312 pages of coded transcripts were produced.
* close to medium complexity
T
Subject Structural Knowledge Math/ Science Design Principles EDP Process CR Planning CF Overall Knowledge and Process Rating (Tools) Build Complexity Boy 06 Medium Low Low High High Low High Medium High Boy 07 Medium Low Medium Medium Medium Low Low Medium Medium Boy 08 Low High Low High Low High Low Low* Medium Girl 06 Low Low Medium Medium Low Low Medium Low Low Girl 08 High High High High High High Medium High Low Girl 09 Low Medium Medium Low Medium Low Medium Medium Medium Boy 03 Low Low Low Low Medium Low Medium Low Low Boy 04 High Medium High Medium High Low Medium Medium Low Boy 05 High Medium High Medium High High Medium High High Girl 03 Low Low Low Medium Low Low Low Low High Girl 04 Low Low Medium Medium High Medium Medium Medium Medium Girl 05 High High High High High High High High High
No clear patterns by single independent variable CR in particular may be the only direct, developmental variable in this context of age appropriate materials and instruction EDP patterns most dependent on build complexity and students tool set: structural knowledge/experience, EF , EDP process skilms
T
meaningful Helps telm the story of the build 2 typical patterns Outlier cases
Methodology Mixing VPA and CI VPA limitations Sample size Session time
Further analysis of subcodes and secondary codes Relative importance of different factors Segmenting data analysis Planning types - short and long term