
SLIDE 1
Creating Animations with R
Yihui Xie
Department of Statistics, Iowa State University
July 21, 2010
useR! 2010 @ NIST, Gaithersburg, MD
- 2
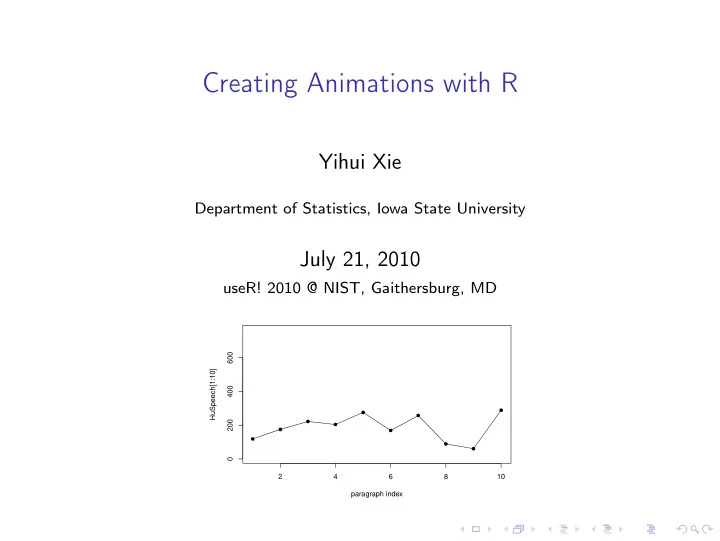
4 6 8 10 200 400 600 paragraph index HuSpeech[1:10]
Creating Animations with R Yihui Xie Department of Statistics, Iowa - - PowerPoint PPT Presentation
Creating Animations with R Yihui Xie Department of Statistics, Iowa State University July 21, 2010 useR! 2010 @ NIST, Gaithersburg, MD 600 HuSpeech[1:10] 400 200 0 2 4 6 8 10 paragraph
4 6 8 10 200 400 600 paragraph index HuSpeech[1:10]
◮ in the beginning, the world was full of math formulae... ◮ let there be animations, and there was (awake) audience ◮ ... ◮ and I created the R package animation
−6 −4 −2 2 4 6 −1000 −500 500 1000
x f(x) = 5x3 − 7x2 − 40x + 100
−4 −2 2 4 −1.0 −0.5 0.0 0.5 1.0
x f(x) = atan(x)
10 15 20 0.0 0.2 0.4 0.6 0.8 1.0 x
0.40 0.45 0.50 0.55 0.60 0.65 0.70 0.0 0.5 1.0 1.5 2.0 0.0 0.5 1.0 1.5 2.0 0.40 0.45 0.50 0.55 0.60 0.65 0.70
20 30 40 50 −1.0 0.0 1.0 Original data 10 20 30 40 50 −0.5 0.0 0.5 1.0 AR(1) coefficient
◮ an HTML page which looks like a movie player ◮ GIF created by ImageMagick ◮ Flash by SWF Tools ◮ PDF by L
AT
1sorry, this impression came from one year ago and might be inaccurate...